Gathered all nutrient data from HUC 07 since 1979. These are all the nutrient parameters available (108). .... several million data points
Used R packages DataRetrieval and EGRET and dplyr
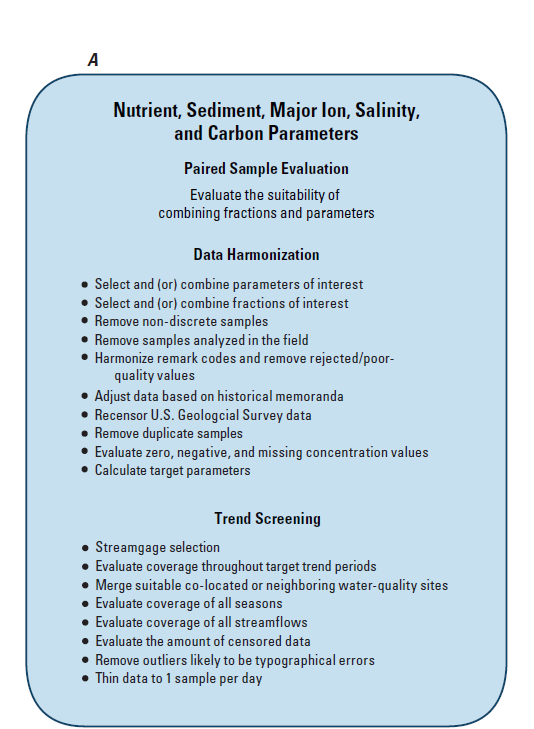
Follow steps in this USGS report, harmonizing data. General process outlined in image below.
https://pubs.er.usgs.gov/publication/sir20175006
Evaluate Parameters to use in trend analysis
- Generally want:
- Total Ng
- Nitrate plus nitrite
- Total P
- Dissolved P
- Sediment
- Combine Fractions/Parameters as listed in this .csv into single dataset when possible. Follow method in USGS document starting on page 23.
- Nitrate / Nitrate plus Nitrite→ in order to get a longer record for trend analysis, it is possible to combine fractions (filtered, unfiltered, total) We assume that we can do this based on the analysis done by USGS. See page 26, nitrate section.
- The preferred parameter/fraction is Filtered Nitrate.
- When filtered and unfiltered nitrate samples exist with same date and time, then use only the filtered data
- at the same site, if there are samples with the non-preferred parameter/fraction (unfilitered or total nitrate) then these can be appended to the dataset to make a longer record
- Nitrate plus nitrite filtered is preferred, but nitrate can be added.
Nitrate plus Nitrite (As N)
- Download Nutrient Data (Starting with HUC-08 Lower Mississippi River for documenting steps; will combine sites from other HUCs into one document for trend analysis)
- other HUCs are 05,06,07,08,10,11 ; then clip to HTF state boundaries if needed.
HUC08Data<-readWQPdata(huc="08", characteristicType="Nutrient", siteType="Stream")
- Nitrate plus Nitrite, the CharacteristicName is "Inorganic nitrogen (nitrate and nitrite)"
- Remove Composite Samples, field observations and quality control samples (the two types we want are "Sample-Routine" and "Sample")
SampleRoutine<-filter(HUC08Data, ActivityTypeCode == "Sample-Routine" | ActivityTypeCode == "Sample")
- Also want to remove preliminary values
- ResultStatusIdentifier = "Preliminary"
- select parameters to harmonize
Inorganic nitrogen (nitrate and nitrite) ; Inorganic nitrogen (nitrate and nitrite) as N ; Nitrate ; Nitrate as N ;
- filter/group by site + date + time
- (Here we are following procedures and assuming that parameters/fractions can be combined into longer dataset in the same way that was done in the USGS report)
- look to see if "Inorganic nitrogen (nitrate and nitrite)" is available at a particular site.
- If so, is there more than one entry for that date and time at the site?
- If yes, keep the data that indicates filtered (dissolved) in column "ResultSampleFractionText"
- if no, keep the unfiltered or total
- If Inorganic Nitrogen not available, go through the same procedure as above for: Inorganic nitrogen (nitrate and nitrite) as N; Nitrate and Nitrate as N; Nitrate. All can be combined to make a longer record if needed.
- If so, is there more than one entry for that date and time at the site?
- Check to see if there are "ResultDetectionConditionText" qualifiers - (Not detected or below detection Limit. .... Still need to figure out how to deal with these properly)
> count(finalResult$ResultDetectionConditionText)

x freq

1 *Non-detect 9

2 *Present <QL 9

3 Below Detection Limit 6

4 Detected Not Quantified 7

5 Not Detected 15050

6 Not Present 1

7 Not Reported 11

8 Present Above Quantification Limit 9

9 Present Below Quantification Limit 1749

10 <NA> 15107
- Determine if units are as N or NO3, change to "as N" when necessary. Want units to be "mg/l as N" in column "ResultMeasure.MesaureUnitCode"
- divide reported as NO3 by constant to get "as N"
- Once the the list of sites is complete, then look at the length of record, and clip to have it be with records from 1979 - 2017 (including 2018-2020 if they're available)
- look at frequency of measurements and data gaps
- do gauge matching process.
- Remove Composite Samples, field observations and quality control samples (the two types we want are "Sample-Routine" and "Sample")