Design and development summary
The Phase II interface will incorporate a new dashboard design and an archive view. The design is summarized below and development is work in progress. Test servers are available and they represent the latest development builds for verify features, capabilities, bug fixes and test usability issues.
The sections below define the views and key attributes for the new user interfaces.
GeoDashboard - http://seagrant.ncsa.illinois.edu
The GeoDashboard is a webapp that provides multiple views into the data. These include:
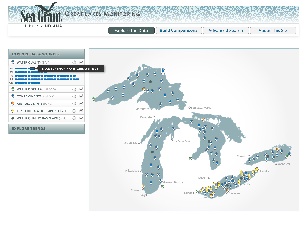
- Explore the Data
- This section represents predefined data sets that users can explore from the map or the data navigation panel on the left. From the data nav panel, users can select data by source or type and open different visualizations relevant to the data type. e.g. timeline, depth profile, etc...
- This section represents predefined data sets that users can explore from the map or the data navigation panel on the left. From the data nav panel, users can select data by source or type and open different visualizations relevant to the data type. e.g. timeline, depth profile, etc...
- Build Comparisons
- This section lets users select data based on location or type and visualize them on the same page. For example, compare Ch-a in Lake Michigan vs. Lake Huron over some time period.
- This section lets users select data based on location or type and visualize them on the same page. For example, compare Ch-a in Lake Michigan vs. Lake Huron over some time period.
- Advanced Search
- A context aware interface that allows users to only see data or visualizations that relevant to their choice of inputs that include: location, source, type and time.
- The search result can be saved as a visualization, downloaded as a data set or the linked saved as a permalink for future reference.
- About this Site
- This section provides more details about the data sources and types.
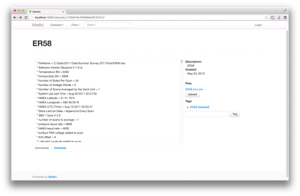
Archive View (Medici v2.0) - http://seagrant.ncsa.illinois.edu:9000/
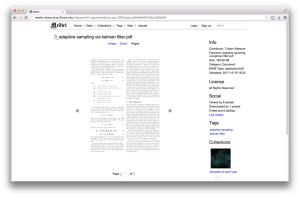
The Archive View is based on Medici 2.0 and provides trusted user an ability to manage data sets, create collections of data sets, and the ability to upload data. Users can tag, annotate, geolocate and make associations between different data sets and types. For example, a report (.pdf) can be associated with a map image (.jpg) and a specific data set collected (.cnv, .csv, etc..) and grouped as a single collection (Spring 2013 Lake Heron Sea Bird Report). The archive view provides file view and basic interface to:
- View Data Set
- View Collection
- Upload Data Set
GeoDashboard View
The following table provides insight to the different perspectives. You can click on an image to view a larger version of the panel.
Explore the Data - Data Navigation | Comments, attributes, behaviors |
|---|---|
|
Note: This main view provides a superset of available data, however, the result of an advanced search can be saved to provide direct access to specific data subset or type. e.g. nutrients in Lake Erie & Huron, etc...
|
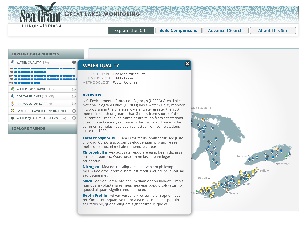
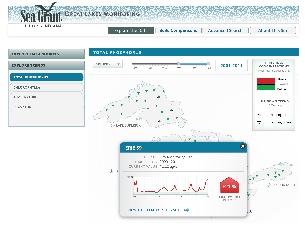
Explore the Data - Info Button | Comments, attributes, behaviors |
|---|---|
 |
|
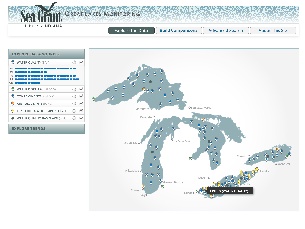
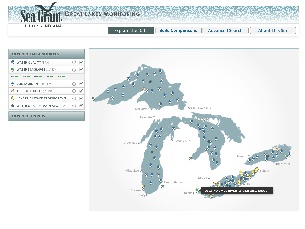
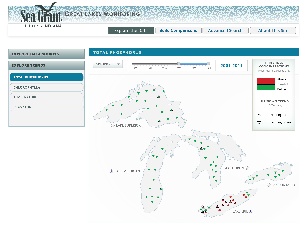
Explore the Data - Selecting data on Map | Comments, attributes, behaviors |
|---|---|
| Select a data source on the map and the corresponding source and set appears in the data navigation column. Double-clicking on either icon (map or data nav) will open the data set to display the available visualization panel. |
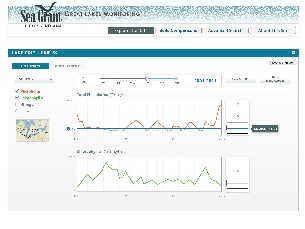
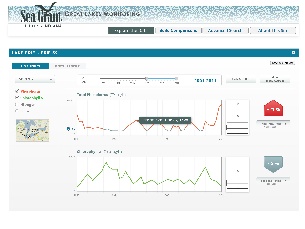
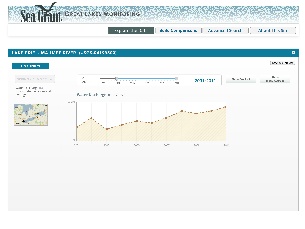
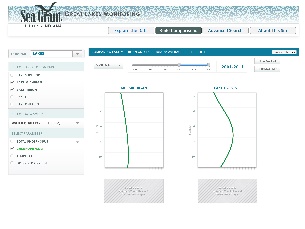
Explore the Data - Time Series Visualization | Comments, attributes, behaviors |
|---|---|
| Once a site is selected a panel will open with visualizations that are associated with that data type. In this case, this data can be displayed in both the time series and depth profile visualizations.
|
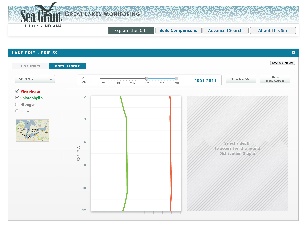
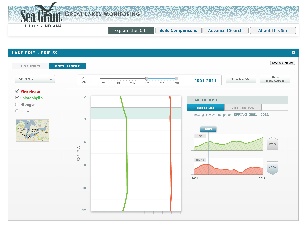
Explore Data - Depth Profiler | Comments, attributes, behaviors |
|---|---|
|
| Depth Profiler
|
Explore - Other sources | Comments, attributes, behaviors |
|---|---|
 | An example of USGS being displayed using the time series visualization. |
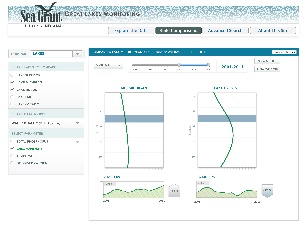
Explore Trends | Comments, attributes, behaviors |
|---|---|
| From the data navigation user can explore the trends in appropriate data types.
Provides quick visual representation about the value of the data in a particular region. Allows the user to select a data set to view the data trend over time. |
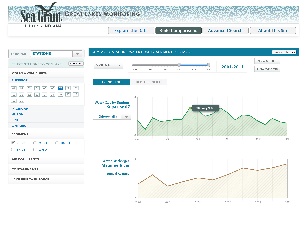
Build Comparisons | Comments, attributes, behaviors |
|---|---|
| Using the data navigation panel users can select data sets to compare them by type and location. The appropriate visualization will appear based on the data type. In these examples, we see the standard time series and depth profile tools. |
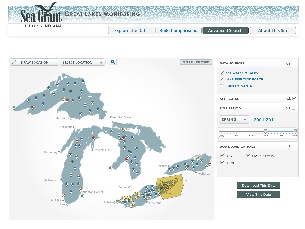
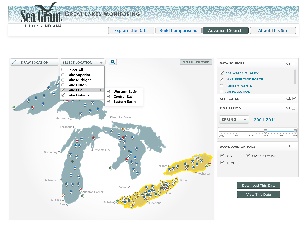
Advanced Search | Comments, attributes, behaviors |
|---|---|
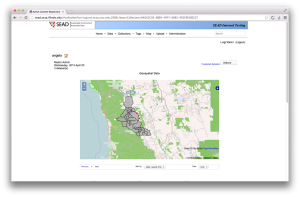
| Advanced search provides a context aware search environment to help simplify complex searches. The user can reduce data overload by selecting a particular region of interest (ROI), a data source, a data type or a time frame to display a subset that meets their interest. Note: data type, attribute and parameter are synonymous and reference a particular data type like Chl-a. The EPA community typically uses the term parameter to a particular data type. If a search parameter (location, source, type, time) is not defined then "ALL" data from that space, source, type or time frame will be returned. Context awareness is achieved by a user selecting a ROI by drawing a polygon on the map or selecting a predefined ROI from a list. This selection will then refine the available data sources, types, and times. Additionally, if a users starts with a source or data type, then those available data points will be reflected on the map. As the user continues to define search criteria, the system display appropriate options and visualizations that meet their inputs. Once complete, the user will have an option to save the link as Permalink for future reference, visualize the results through an "Explore" visualization or save the data set/subset in an appropriate format. |
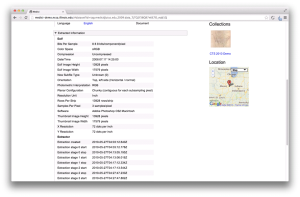
Archive View
| Data Set View | Comments, attributes, behaviors |
|---|---|
| The Data Archive provides:
|

| Upload | Comments, attributes, behaviors |
|---|---|
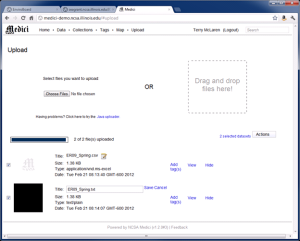 | Upload interface
|