...
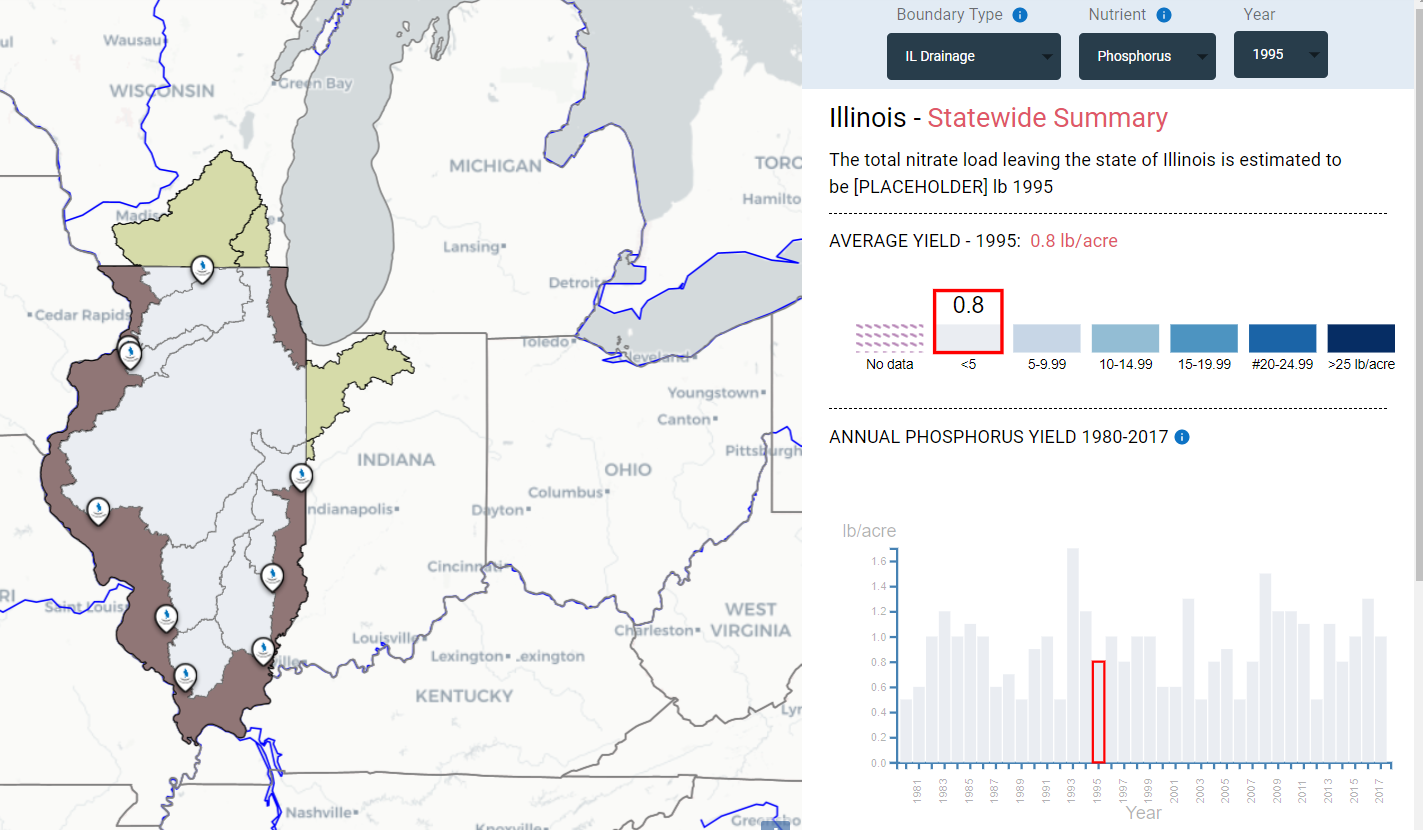
- Phosphorus scale needs to be recalibrated because range is much different than nitrate (
)Jira server JIRA serverId b14d4ad9-eb00-3a94-88ac-a843fb6fa1ca key GLGVO-661 - In the Trend Sites view, need to replace Nitrate graphs with Phosphorus (Ted needs to get NCSA data) (
)Jira server JIRA serverId b14d4ad9-eb00-3a94-88ac-a843fb6fa1ca key GLGVO-659 - HUC-8 data needs to be examined and replaced. Correct data from Greg McIsaac is in this spreadsheet, and rather than yearly data, it is just two time periods.
- Need to examine all the places where we use the terms nitrogen and nitrate and make them more specific- Total Nitrogen or Nitrate as N
- Need to prominently display the year on the map (there has been some user confusion thinking we were looking at an aggretation of years on the map)
- Also want to consider for the Illinois Drainage and Trend Sites sties how we will have an alternate visualization that looks at aggregations of years (for instance 1980-1996 and also 2013-2017. Or in WRTDS, how we indicate trends in certain decades or other time periods.
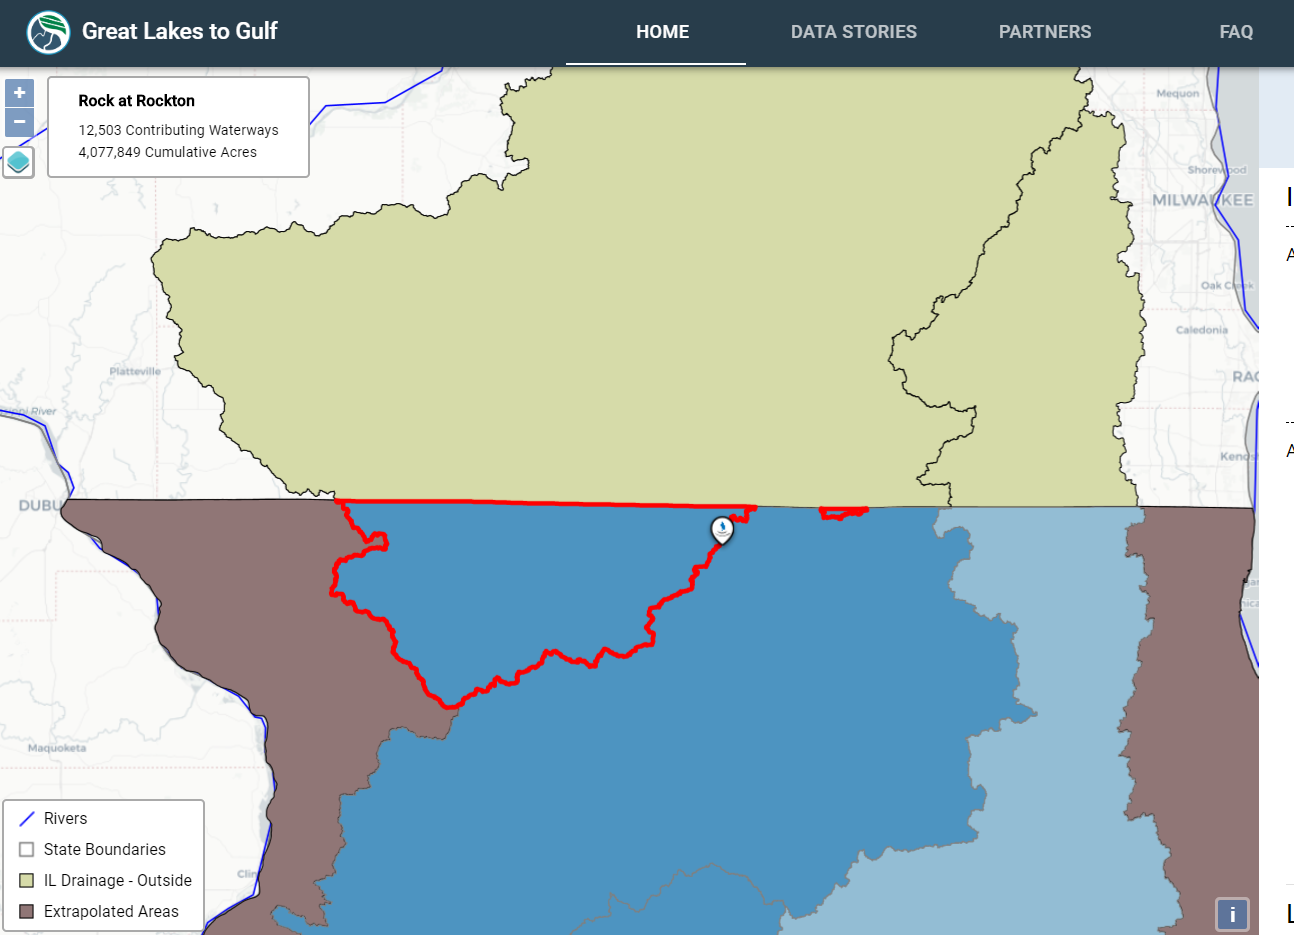
- Need to examine the polygon for the Rock River at Rockton- there is some portion of the watershed that will have to be in the "extrapolated" color. (In the image, it's the highlighted red polygon.) This is extrapolated because it is in Illinois, but when using the Rock River at Rockton to subtract the Wisconsin Portion of the watershed, the portion in Illinois has to be "added back in" to the Rock River numbers, and hence is extrapolated.
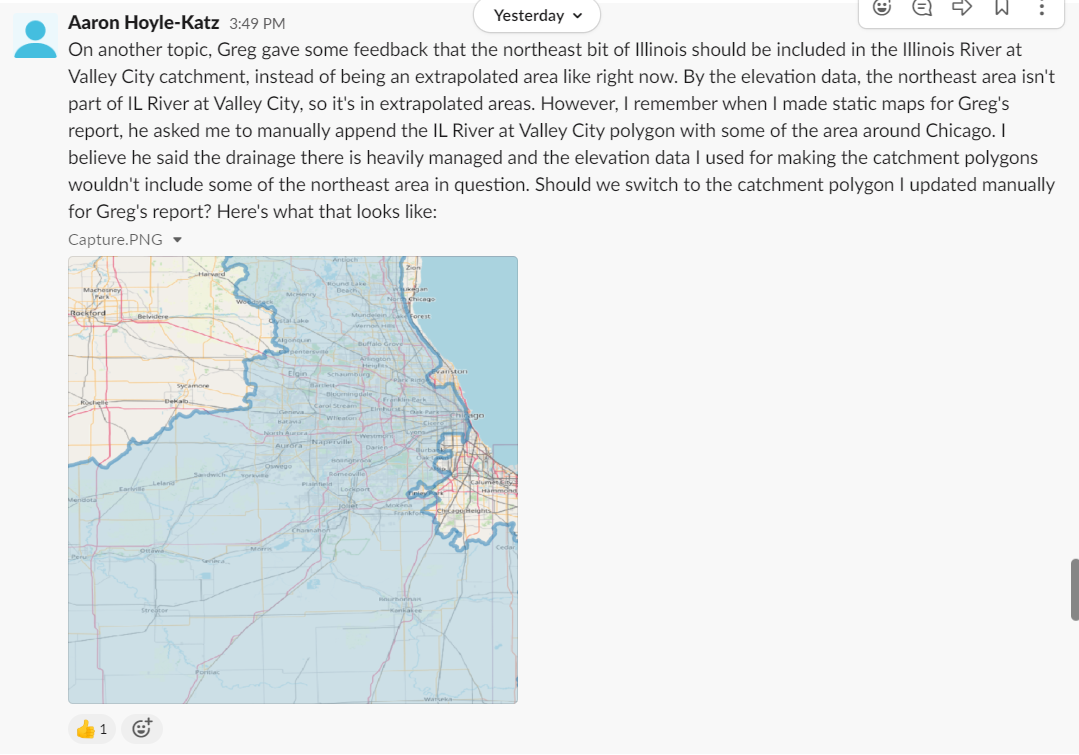
- Need to manually add the Chicago watershed back into the Illinois River due to the historic reversal of the river and hydrologic changes.
-
- Need to work on exploratory Analysis page
- make sure all data present
- when there is only a minimal change, we'll want to indicate that as "no trend" or "weak trend" instead of up or down.
- need more documentation on the "trending up/down"
- threshold needs units
- Need to explain what time period our threshold is for.
- Geostreaming app -
- associate discharge gauges with continuous monitoring sites and calculate loads
- overlay discharge onto the WQ data charts
- Need overlay of Mississippi River watershed on basemap
- associate discharge gauges with continuous monitoring sites and calculate loads
- Need to figure out how to direct people to storyboards from specific spots on the site.
- Clean up "search and download" page- specifically the search by area list.
Critical to do before Walton Grantees Webinar:
...