PART I: DATABASE DESIGN FOR TRACKING
Overall goal is to add a new group of Mongo collections to track usage/user activity on a per-resource basis:
...
- implement 2 new collections in Mongo
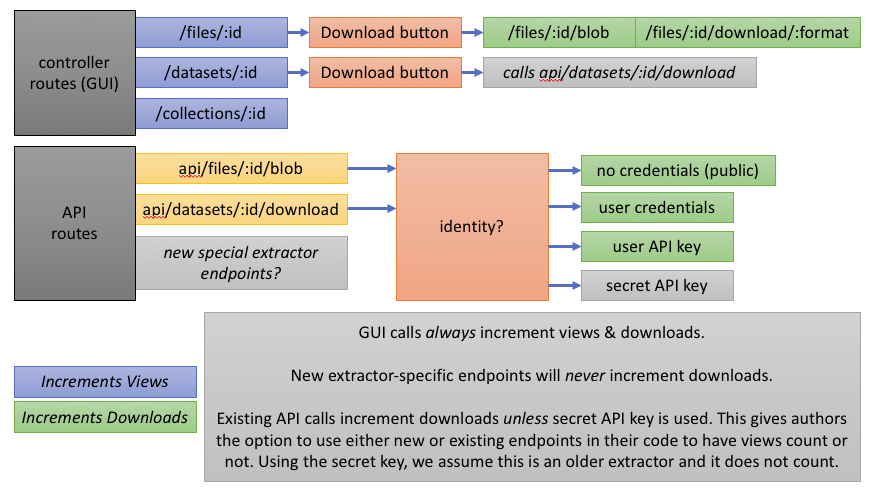
- StatisticTotals - total views & downloads for each resource, including timestamp for last viewed and last downloaded. for driving use case, downloads/"access" is more important than page views which don't necessarily represent engagement.
- StatisticUser - views & downloads on a per-user basis. this would include via the GUI and API calls using the user's API key, with ability to exclude automated extractors from these statistics even if they use a user API key to fetch data.
- Each collection will track views & downloads for files and datasets, and views for collections.
PART II: NEW API ENDPOINTS FOR REPORTING
The other component building off of this feature is the reporting capability that lets privileged users download CSV reports summarizing usage.
Proposed API endpoints to support this:
- /api/reports/metrics/files
- /api/reports/metrics/datasets
- /api/reports/metrics/collections
These first three would provide a list of any datasets or collections that have views or downloads > 0, ideally in descending order but that could be done in Excel (for example) afterward if sorting has significant impact on API performance. These statistics are tracked per resource as totals and there is no identifying information associated in these reports. I imagine a report structure like:
| resource_id | resource_name | views | downloads | last_viewed | last_downloaded |
|---|---|---|---|---|---|
| 12345678 | Max's Dataset | 3 | 1 | 2018-08-16 4:30:12 | 2018-08-14 10:20:12 |
| ... |
I am going to explore whether it is feasible to also include a simple /metrics report without a resource type that would include all 3 categories, but I think it's also useful to have them available separately as well.
- /api/reports/metrics/files_by_user
- /api/reports/metrics/datasets_by_user
- /api/reports/metrics/collections_by_user
These reports would include additional categorization by specific user. These endpoints are a bit trickier because permissions become more of an issue - it's no longer just a question of whether the requesting user has permission to see each resource, but also defining some set of rules that dictate whether other users appear in the report or not. I am not sure whether we have other features that address this (e.g. a check whether you have permission to see another user's User page - if that is equivalent to being allowed to see another user's activity, perhaps not so tricky).
In general it's important to point out that the user and non-user reports will not necessarily total to the same numbers. The totals will include public views and downloads for publicly available datasets that won't have any user associated with them, and depending on permissions and the requesting user, some users may be omitted from the user reports. With carefully defined permissions model and a user with appropriately elevated privileges, this can be mitigated.
Ultimately the goal is to support visualization of these results as well. One thought is that it could also be valuable to include parent resource information:
- for files, information on the dataset and space containing the file
- for datasets, information on the collection and/or space containing the dataset
- for collections. information on the parent collection and/or space containing the collection
This could facilitate some cool aggregate charts or allow an interesting look at breakdowns at a higher level than a simple long list of resources, e.g. a pie chart for a collection showing which datasets in that collection are getting the most views. Including these relationships in the report would make this kind of chart much easier to generate in an environment like Excel.