...
- Need to have better explanation of the Avg. Annual N yield graph (Ted Kratschmerto provide information)
- On the Illinois Drainage page, we need to have under the Overall Summary, a box somewhere that says "The total nitrate load leaving the state of Illinois is estimated to be xxxx lb 2019" or whatever year. We need can get that information from the graphs on page 10 & 11. (Aaron may Hoyle-Katz may have this, or perhaps he can get it from McIsaac) https://www2.illinois.gov/epa/topics/water-quality/watershed-management/excess-nutrients/Documents/NLRS_SCIENCE_ASSESSMENT_UPDATE_2019%20v7_FINAL%20VERSION_web.pdf ... on the "Illinois Drainage" page we should also add an Annual Load graph along with the Annual Yield
- Comments:
- Ted Kratschmer is "Illinois drainage page" a dashboard with "IL drainage" boundary type? or story board? I meant the dashboard view of Illinois Drainage. I'm proposing we add text above the yield chart. Also need to add a chart above the yield chart that shows the statewide load. -TK
- Comments:
- Do we have polygons for the "unmonitored area" in illinois for the Illinois Drainage view? ... I think it would be clearer if we displayed those polygons along with the existing catchments and had a legend that said "Load from this area extrapolated" Aaron Hoyle-Katz ... This is a lower priority at this point, but still important.
- Comments:
- We need to think about this. If the polygon shows, then users want to click and try to see the data. Yes, what you say makes sense. What if we used an additional shading similar to "no data" shading, and have it say "area extrapolated to calculate statewide load"
- Yes, we have a polygon shows all the Illinois areas not covered by stations. This is the same polygon that we used in the "Tracking Trends with GLTG" storyboard, slide 2. -AHK
- Comments:
- The watershed boundary polygon in Minnesota says station USGS 05418720 ... This is the station name for a different station (Maquoteka river in Iowa). I'm unsure what the actual station number is. Something on the Minnesota River... Mankota?
- Comments:
- Ted Kratschmer who knows this info? Does Aaron know? Aaron Hoyle-Katz do you know what the catchment on the "Watershed Boundary" represents? the one in Minnesota that shows up.
- MI 0035 is the station number, I believe this mislabel will be fixed soon. -AHK
- Ted Kratschmer who knows this info? Does Aaron know? Aaron Hoyle-Katz do you know what the catchment on the "Watershed Boundary" represents? the one in Minnesota that shows up.
- Comments:
- BUG: in the Watershed boundary view, the title on the right says "Illinois" Please change to the state where the station is (Kaveh Karimi Asli)
- In the watershed boundary view before clicking a station, the "illinois overall summary" graph and chart are displayed. Need to either remove those until something is clicked on, or perhaps show the graph for the total load to the Gulf of Mexico (data can be found in the nitrate load tab of this worksheet. "Tons" is the main bar, and the confidence interval bounds are TONS_L95 and TONS_U95. Annual Load to Gulf of Mexico.csv (Kaveh Karimi Asli)
- Comments:
- Team needs to discuss this matter
- Confluence Page Loads to gulf of mexico for watershed dashboard
- Comments:
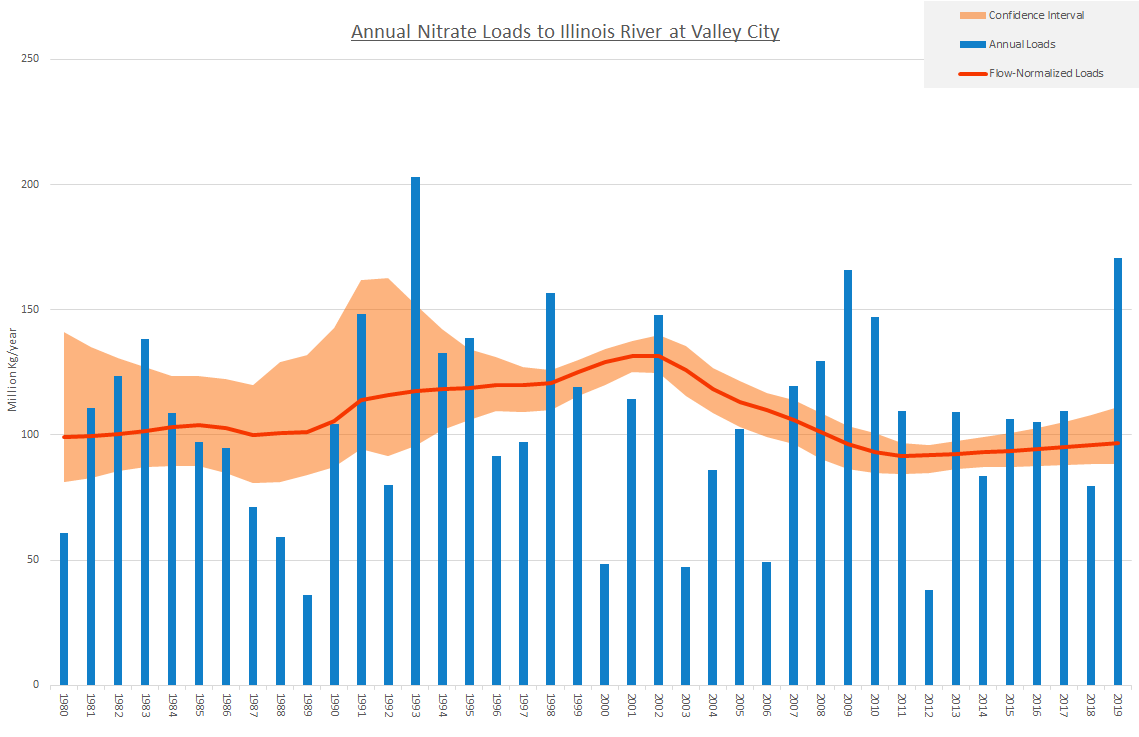
Hoping to get the WRTDS output for this station and Valley City done today or this weekend so they can be implemented on the dashboard as an example of Sentinel Site.WRTDS outputs for Illinois River Valley City and Iowa River Wapello are attached below. Annual "summary" should be the Annual Load. Data and example charts below. Phosphorus is not done yet, that will take some additional work, but can be added later.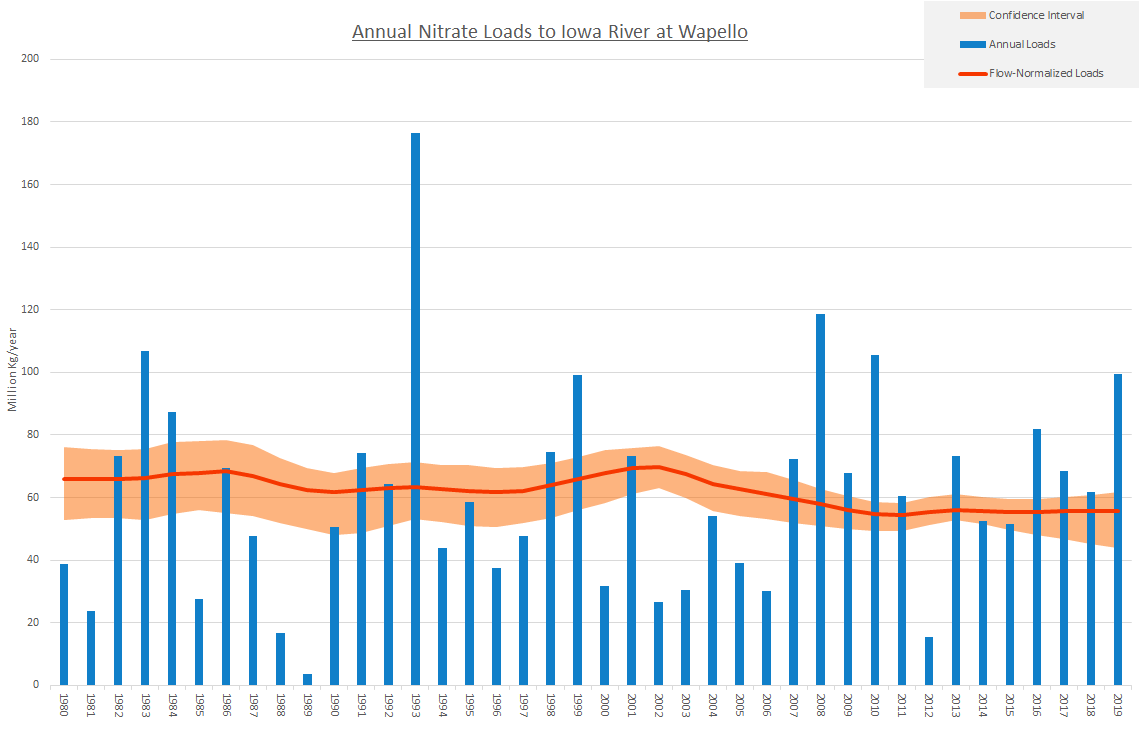
...