Collaborative area for discussing Bugs, Updates, and Modifications to Great Lakes to Gulf
Critical to do before Walton Grantees Webinar:
Not DONE
- Need to have better explanation of the Avg. Annual N yield graph (Ted Kratschmerto provide information)
- Also need a way to get back to the Illinois "state-wide" or "overall summary" nutrient yield chart after clicking into a watershed while on the Illinois Drainage screen.
- Comments:
- Ted Kratschmer currently, if you click the station again, it will go back to "overall summary" (ok- It seemed like the other day that was not happening, but maybe I missed it -TK)
- Bug: when turn off the selection of watershed, the popup should be disappeared.
- Comments:
- On the Illinois Drainage page, we need to have under the Overall Summary, a box somewhere that says "The total nitrate load leaving the state of Illinois is estimated to be xxxx lb 2019" or whatever year. We need can get that information from the graphs on page 10 & 11. (Aaron may have this, or perhaps he can get it from McIsaac) https://www2.illinois.gov/epa/topics/water-quality/watershed-management/excess-nutrients/Documents/NLRS_SCIENCE_ASSESSMENT_UPDATE_2019%20v7_FINAL%20VERSION_web.pdf ... on the "Illinois Drainage" page we should also add an Annual Load graph along with the Annual Yield
- Comments:
- Ted Kratschmer is "Illinois drainage page" a dashboard with "IL drainage" boundary type? or story board? I meant the dashboard view of Illinois Drainage. I'm proposing we add text above the yield chart. Also need to add a chart above the yield chart that shows the statewide load. -TK
- Comments:
- Do we have polygons for the "unmonitored area" in illinois for the Illinois Drainage view? ... I think it would be clearer if we displayed those polygons along with the existing catchments and had a legend that said "Load from this area extrapolated" Aaron Hoyle-Katz ... This is a lower priority at this point, but still important.
- Comments:
- We need to think about this. If the polygon shows, then users want to click and try to see the data. Yes, what you say makes sense. What if we used an additional shading similar to "no data" shading, and have it say "area extrapolated to calculate statewide load"
- Comments:
- The watershed boundary polygon in Minnesota says station USGS 05418720 ... This is the station name for a different station (Maquoteka river in Iowa). I'm unsure what the actual station number is. Something on the Minnesota River... Mankota?
- Comments:
- Ted Kratschmer who knows this info? Does Aaron know? Aaron Hoyle-Katz do you know what the catchment on the "Watershed Boundary" represents? the one in Minnesota that shows up.
- Comments:
- BUG: in the Watershed boundary view, the title on the right says "Illinois" Please change to the state where the station is
- In the watershed boundary view before clicking a station, the "illinois overall summary" graph and chart are displayed. Need to either remove those until something is clicked on, or perhaps show the graph for the total load to the Gulf of Mexico (data can be found in the nitrate load tab of this worksheet. "Tons" is the main bar, and the confidence interval bounds are TONS_L95 and TONS_U95. Annual Load to Gulf of Mexico.csv
- Comments:
- Team needs to discuss this matter
- Comments:
- Hoping to get the WRTDS output for this station and Valley City done today or this weekend so they can be implemented on the dashboard as an example of Sentinel Site.
- UPDATE: rename "watershed boundary" to "Trend Watersheds" under Boundary Types
WIP:
- We need to add a link (citation) to McIsaac's report where the data comes from on the HUC-8 dashboard view https://www2.illinois.gov/epa/topics/water-quality/watershed-management/excess-nutrients/Documents/NLRS_SCIENCE_ASSESSMENT_UPDATE_2019%20v7_FINAL%20VERSION_web.pdf ... I think having something under the graph on the right hand side would work fine. (Aaraj Habib GLGVO-630 - Getting issue details... STATUS )
In-review:
- Move variable dropdowns on the home page to the sidebar (Kaveh Karimi Asli)
- Add catchment polygon for 1) Iowa River at Wapello and 2) Illinois River at Valley City (Valley City is already in use in the Illinois Dashboard.) (Diego Calderon GLGVO-629 - Getting issue details... STATUS )
DONE:
- when you follow link to the geostreaming app, there is no way to get back to the landing page / dashboard page from the geostream app.
- Already implemented. I will be deploied. We will inform you when it will be deploy
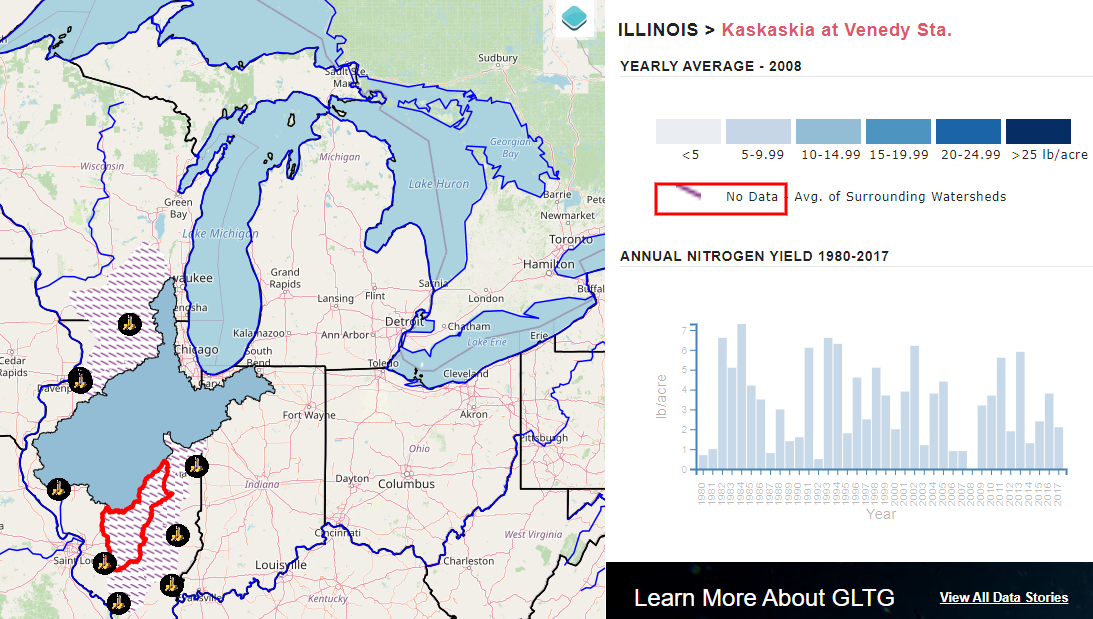
- on dashboard page, need to get rid of the "no data - avg of surrounding watersheds" thing under the legend. (Kaveh Karimi Asli)
- Comments:
- Ted Kratschmer we actually have a situation with no data. and I think that it needs the information about no data as shown below:
- Ted Kratschmer Could you give us why do you want to remove this? or any other suggestion?
- Proposed action:
- Remove "avg of surrounding watersheds" and still leave "No data" for the year which doesn't have data. (I agree. That makes sense -TK)
- Update "no data" icon
- Is it possible to make the image for the "no data" legend clearer? It's hard to tell that it's a pattern. → Yes. we are working on it. (This looks great -TK)
- Suggested design:
- Comments:
- Please replace the boundary type info box text on the Dashboard with the attachment Dashboard boundary type info box Dashboard Boundary type info box.docx (Kaveh Karimi Asli)
- BUG: in the watershed boundary view, there is no way to de-select the watershed polygon to go back to a main view (Kaveh Karimi Asli)
- We need to display station icon
- It's resolved in the new version. You can deselect the watershed by clicking on it again.
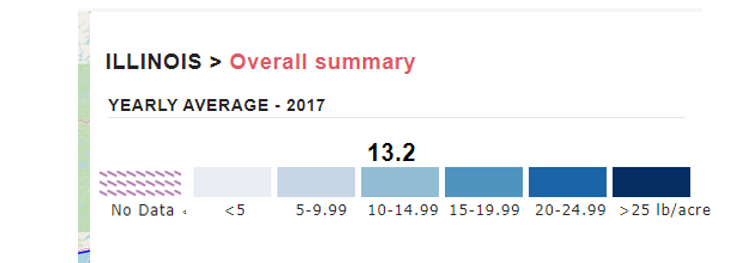
- On IL drainage dashboard, replace "Overall Summary" with "Statewide Summary" ; Also replace "Yearly Average - 2017" with "Average Yield - 2017" (Diego Calderon GLGVO-628 - Getting issue details... STATUS )
- BUG: Dashboard, showing IL drainage boundary type: from beginning state, when you click on a watershed, the little popup box opens and shows contributing waterways and acres, but it does not give the name of the watershed. After you click a station icon, it does show the name, but when you click on a different watershed, the box moves, but the information does not change. Only after clicking another station does the information in the box change. (Already fixed in the new version).