Landing Page
Functions
Data
View
Select
View Input data
MIR
sensors (circles on map)
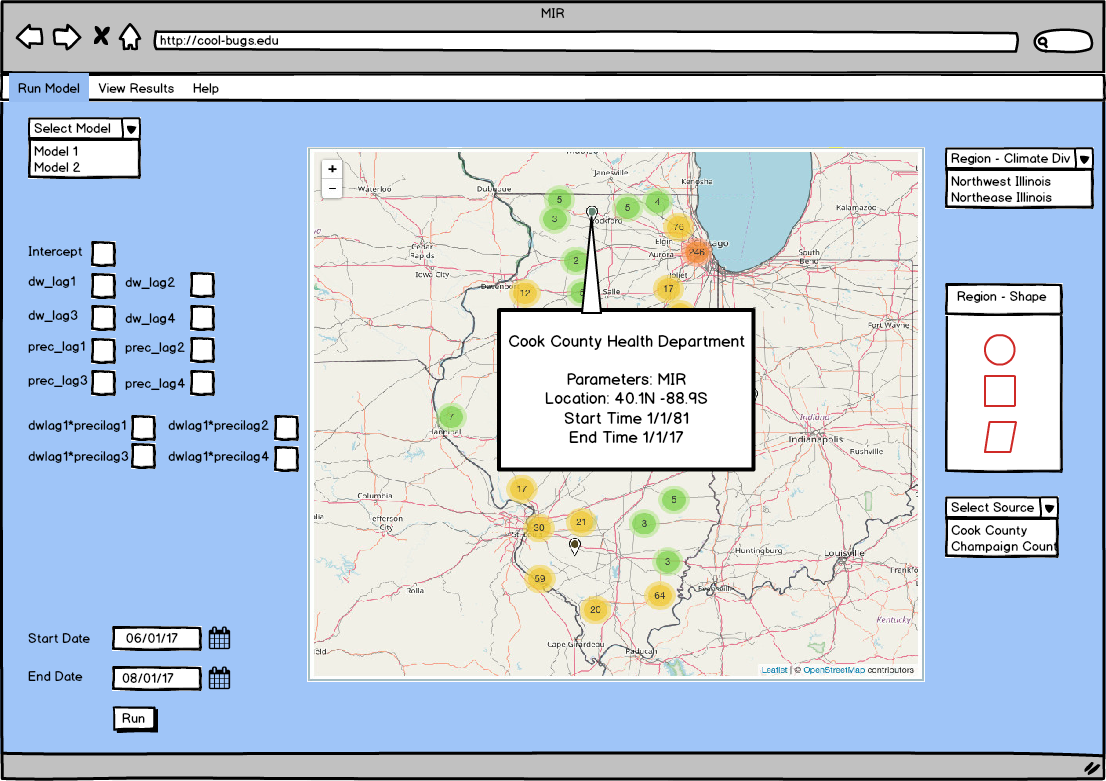
sensor details - popup by clicking on sensor
popup by sensor
popup by region
Weather
heat map
precipitation
temp
popup by region
Weather Forecast
heat map
precipitation
temp
popup by region
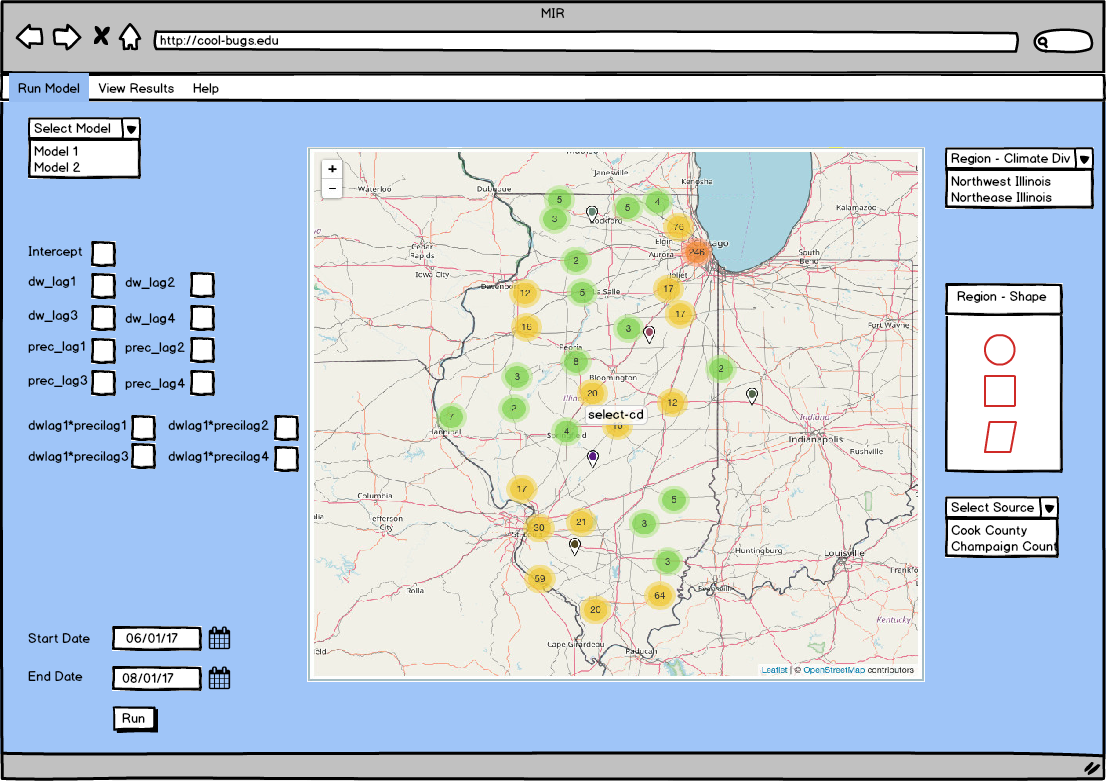
Run Model
Select input data
primary
region
secondary
source
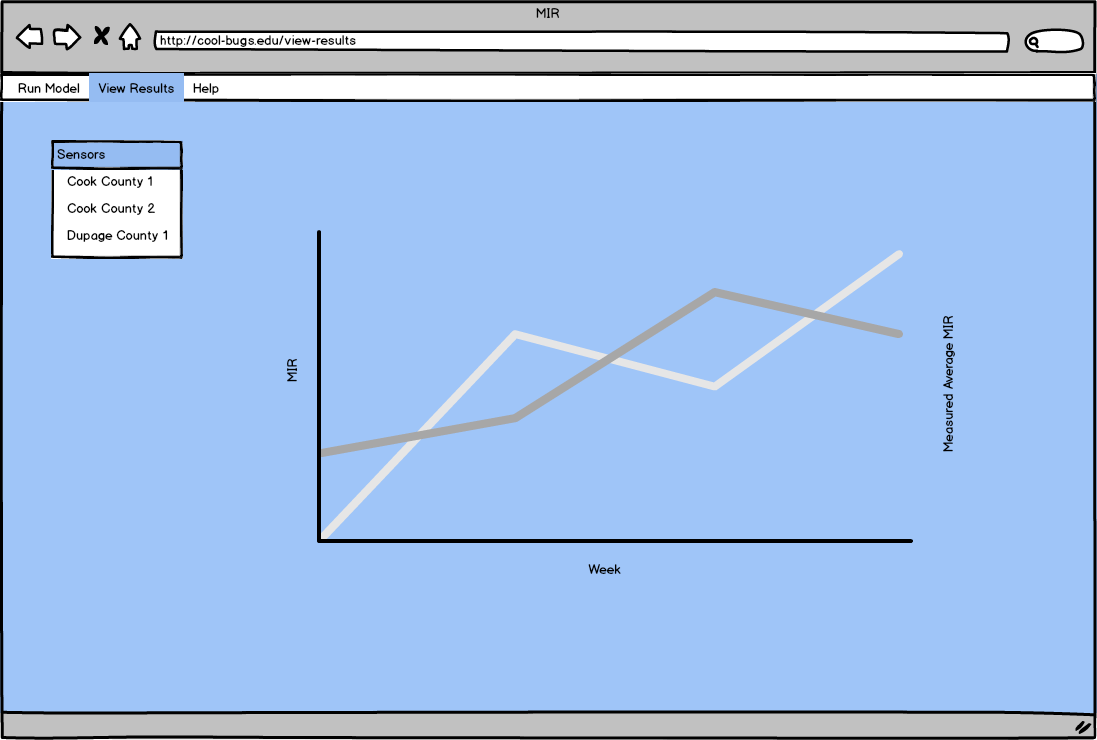
opens new tab
~/view-results
Landing Page
Circles on Map show groups of sensors by count
pills show single sensor (click on sensor to view details
Popup
shows details of that sensor
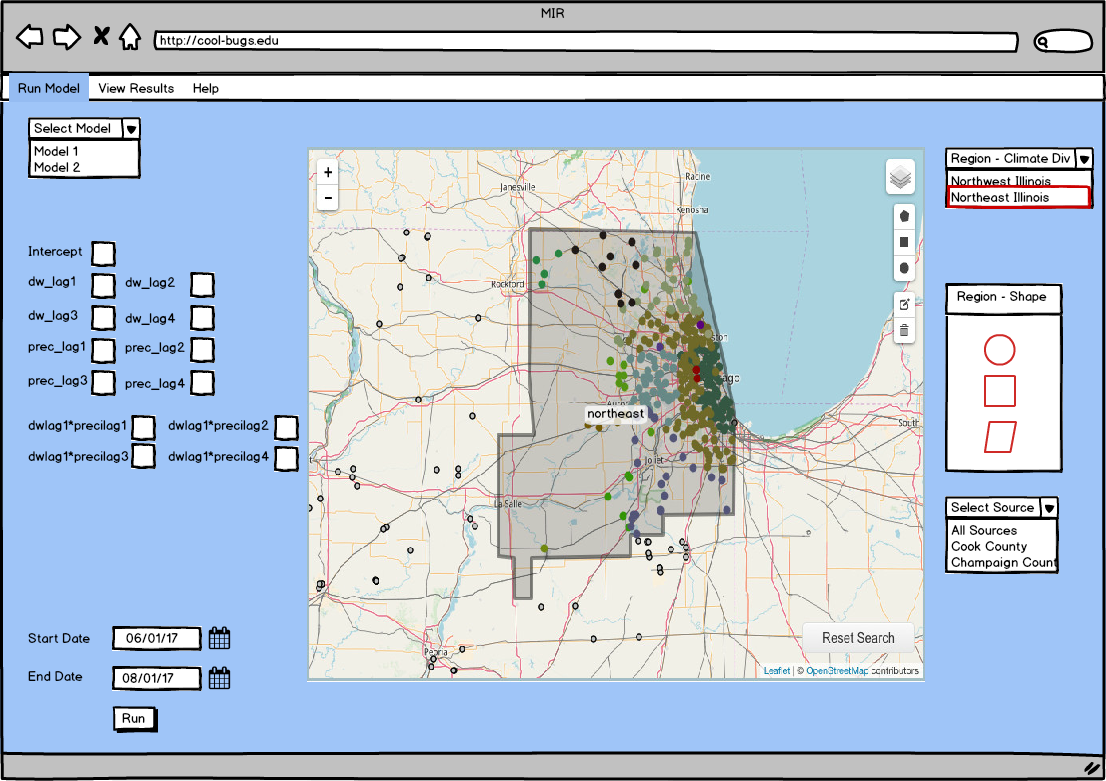
Run Model
select input data
primary - region
can select by predefined shape (climate division or state)
or can use shape tool
secondary - source
select a source from dropdown
Select start and end date
Press 'Run'
Results show in separate tab (or possibly below map)