Attached is the data for the annual nitrate load to the gulf of mexico, in tons.
This data can be used for a chart showing the load and flow normalized load to the gulf. Aaron Hoyle-Katzhas created similar graphs for Nutrient Trend Sites (Sentinel Sites) that will be used for the watersheds in this view. The data are attached, but I will create a new page specifically for this.
These are similar to a graph produced by USGS. The data used to make this graph is attached, and i'm hoping to reproduce it to be shown on the dashboard watershed view. This will be the default when no watershed is selected. See powerpoint slide.
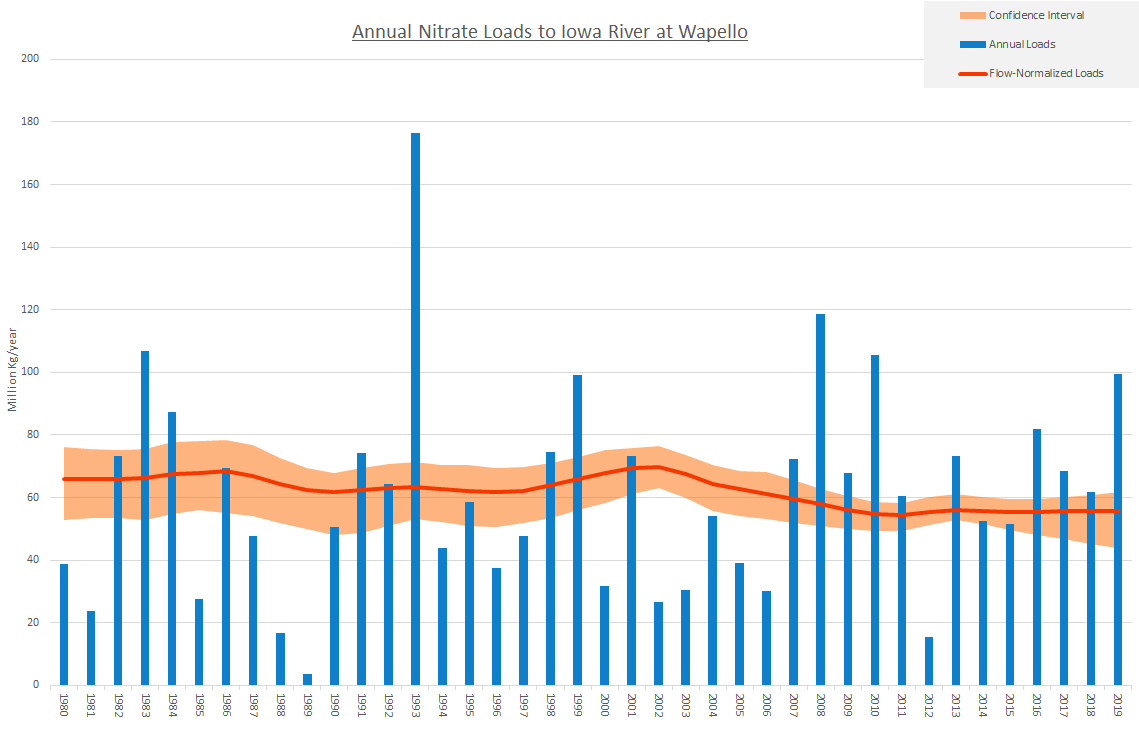
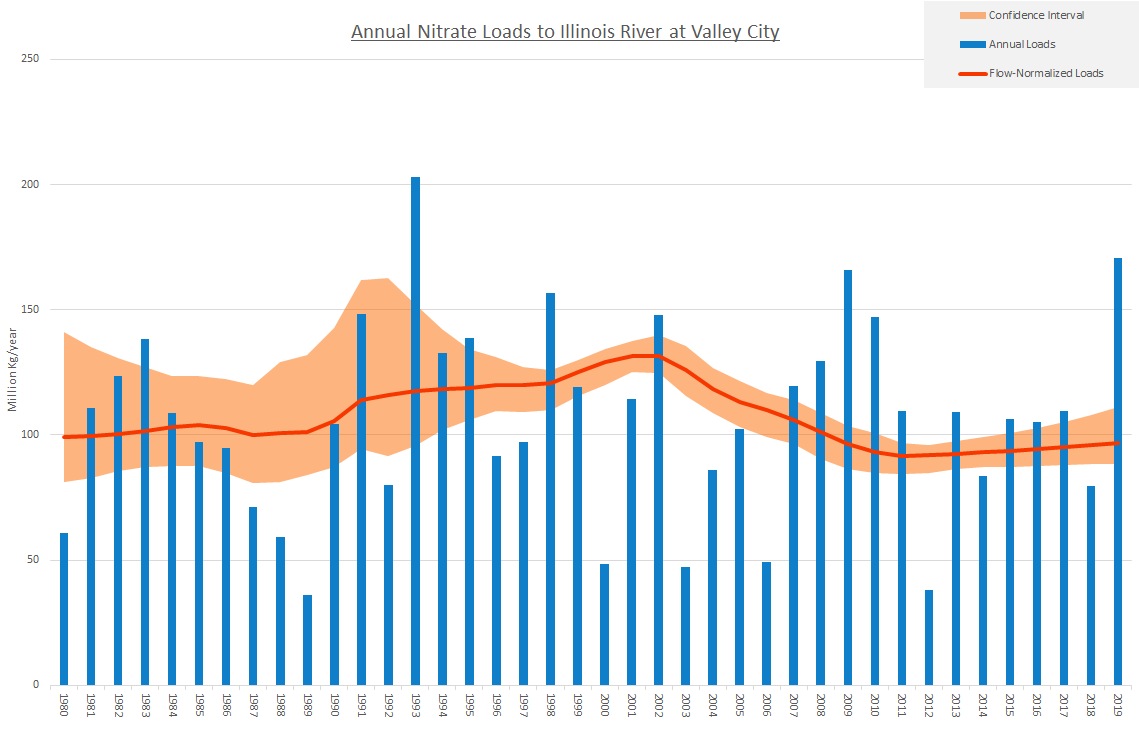
Annual Load to Gulf of Mexico
X axis: Water Year (Column E)
Y Axis: Annual Load, tons (gross load is the number Column G with the label REGHIST in column F shown as bars); Flow Normalized Load - value is column G with WRTDS_FN label in column F, lower Confidence interval column H, Upper CI column I- shown as a line with shading.
 Annual Load to Gulf of Mexico.csv