Log in
Linked Applications
Loading…
Confluence
Spaces
People
Hit enter to search
Help
Online Help
Keyboard Shortcuts
Feed Builder
What’s new
Available Gadgets
About Confluence
Log in
Vector Borne Disease
Pages
Blog
Space shortcuts
Meeting notes (2)
Page tree
Browse pages
Configure
Space tools
A
t
tachments (2)
Page History
Page Information
Resolved comments
View in Hierarchy
View Source
Export to PDF
Export to Word
Pages
CDC Vector Borne Disease
Data
Jira links
Model Graphs
Created by
Marcus Slavenas
, last modified on
Feb 21, 2019
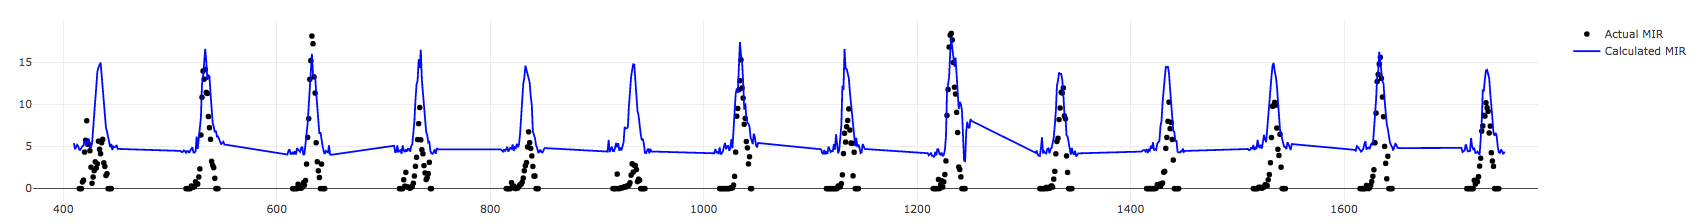
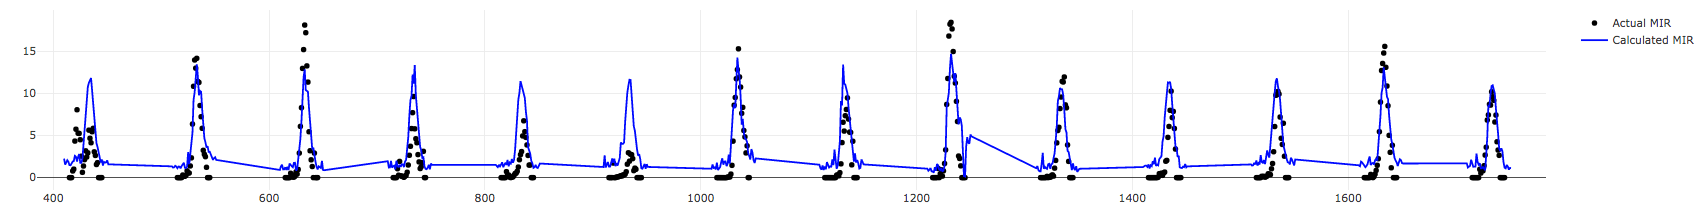
Graphs for showing difference between before and after fixing seasonal weeks for seasonal normals
Wrong
Correct
No labels
Overview
Content Tools
{"serverDuration": 73, "requestCorrelationId": "c9286e017a1cf330"}