Landing Page
| Functions | Data | View | Select |
|---|---|---|---|
| View Input data | |||
| MIR |
|
| |
| Weather |
|
| |
| Weather Forecast |
|
| |
| Run Model | |||
| Select input data |
|
|
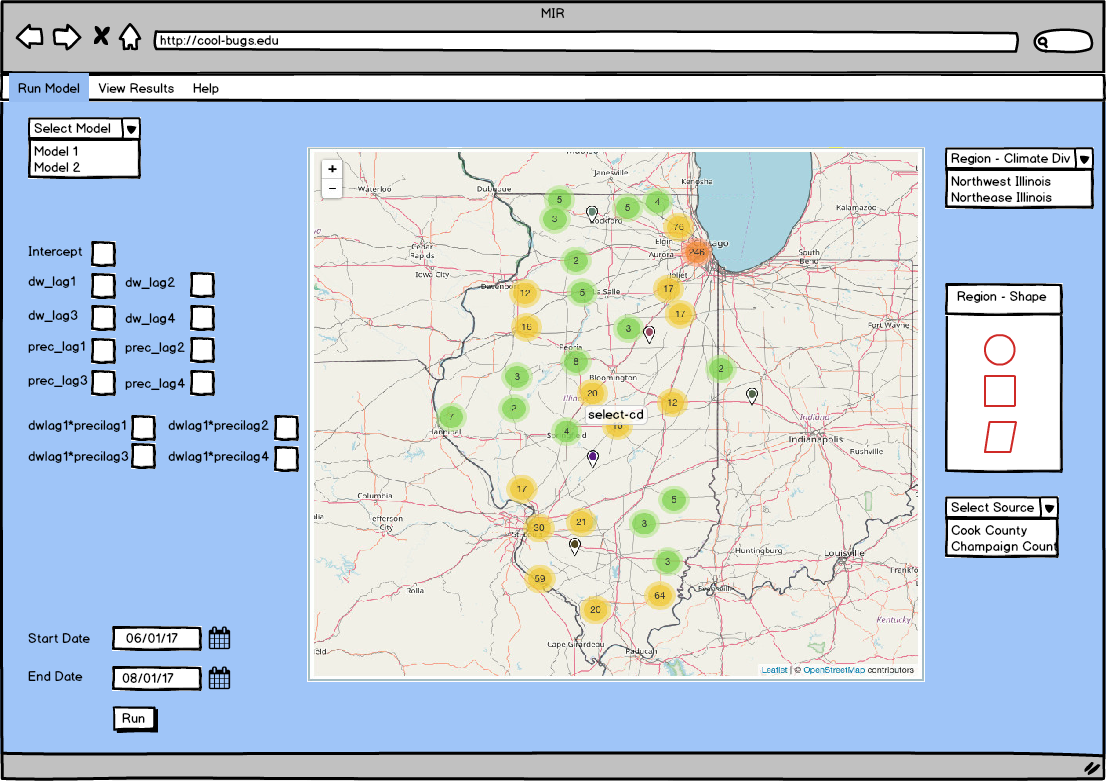
Landing Page
- Circles on Map show groups of sensors by count
- pills show single sensor (click on sensor to view details)
Landing Page showing sensors and sensor groups
Landing Page Heat Map

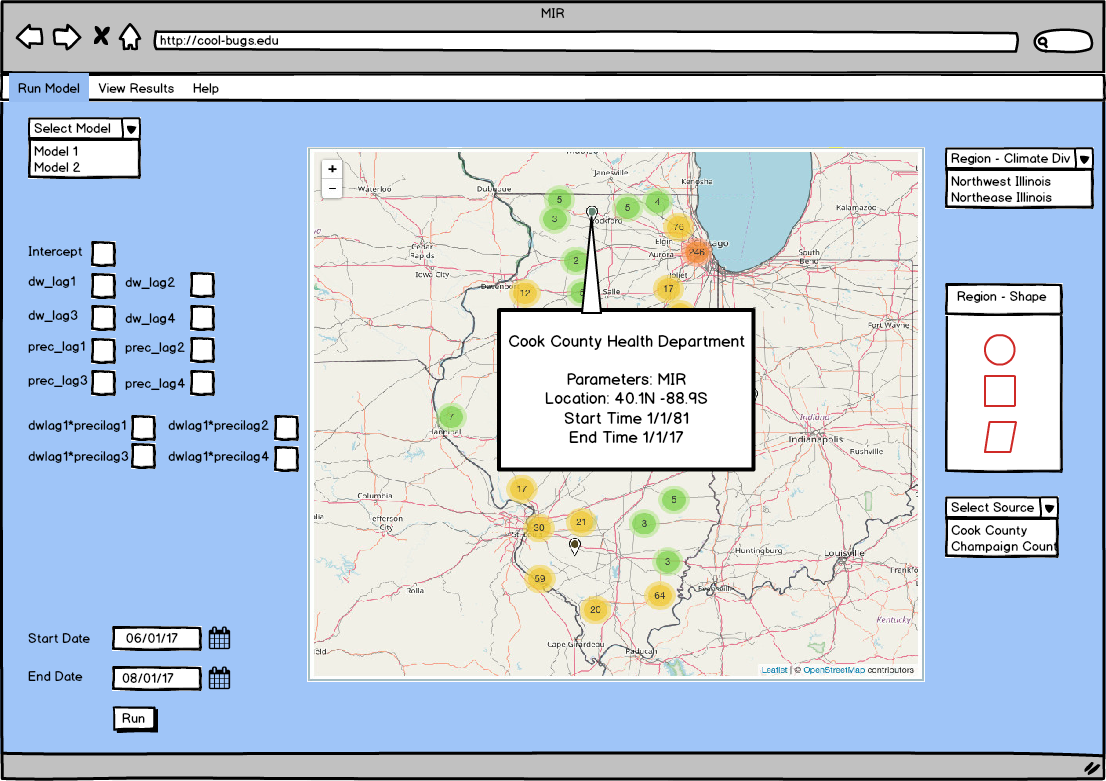
Popup
- shows details of that sensor
Popup of Sensor
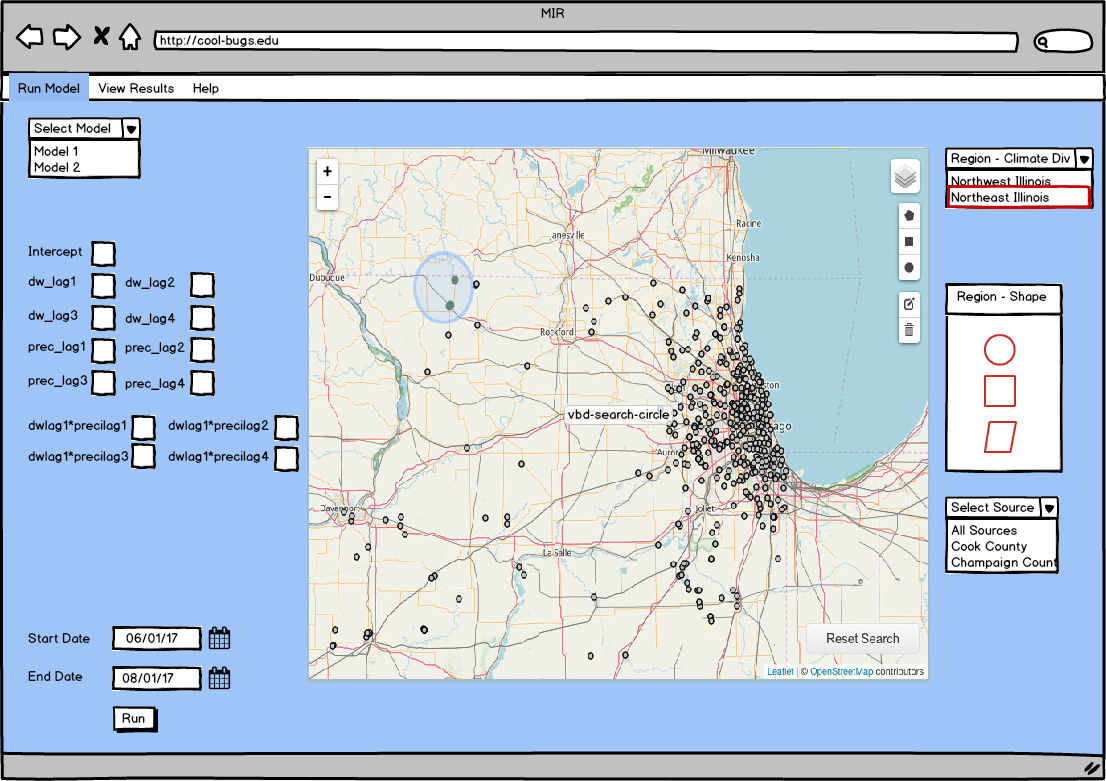
Run Model
- select input data
- primary - region
- can select by predefined shape (climate division or state)
- or can use shape tool
- secondary - source
- select a source from dropdown
- primary - region
- Select start and end date
- Press 'Run'
- Results show in separate tab (or possibly below map)
Select model region by climate division or state (then select further by source)
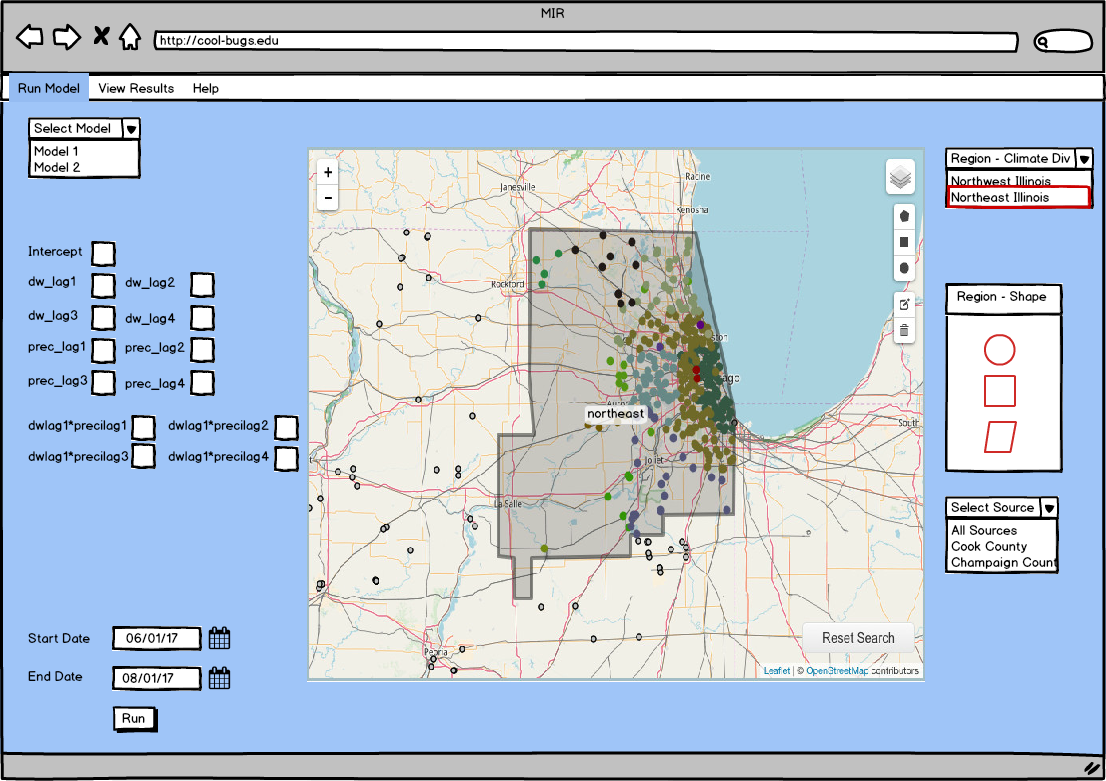
Select Model Region with selection tool
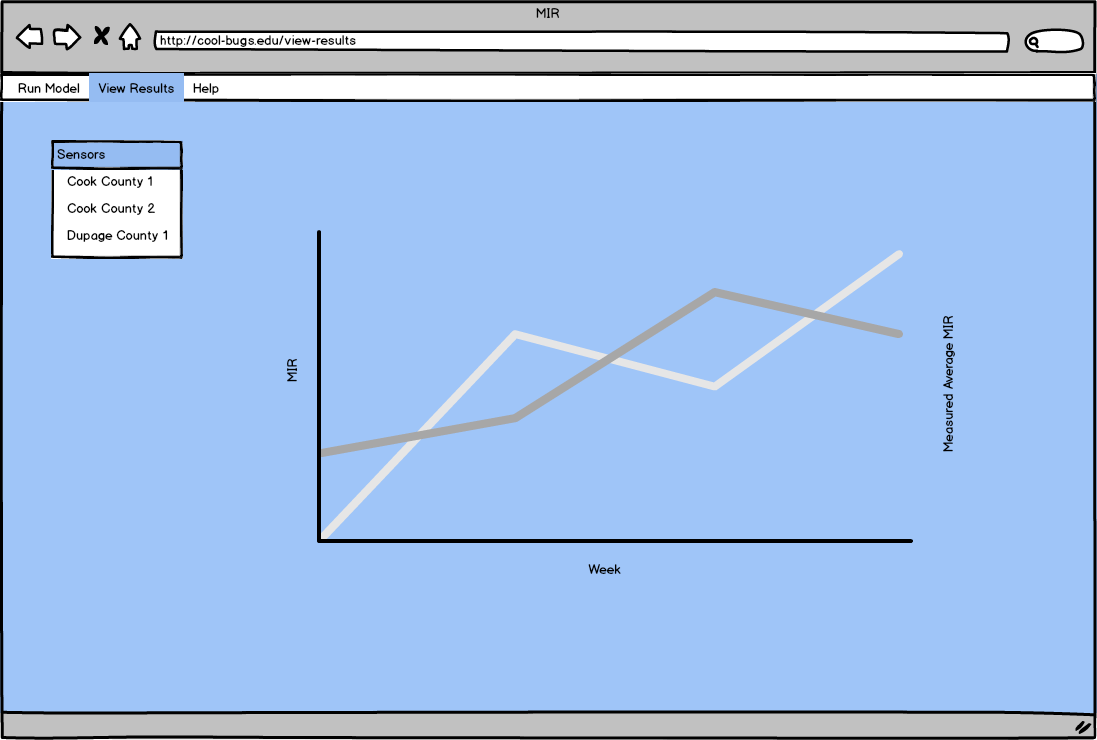
View Results