Uploaded image for project: 'GeoDashboard'
  1. GeoDashboard
  2. GEOD-126

Hierarchical Clustering of variables

XMLWordPrintableJSON

    • Icon: New Feature New Feature
    • Resolution: Fixed
    • Icon: Major Major
    • Sea Grant 2.0-alpha 1
    • None
    • Analytics
    • None

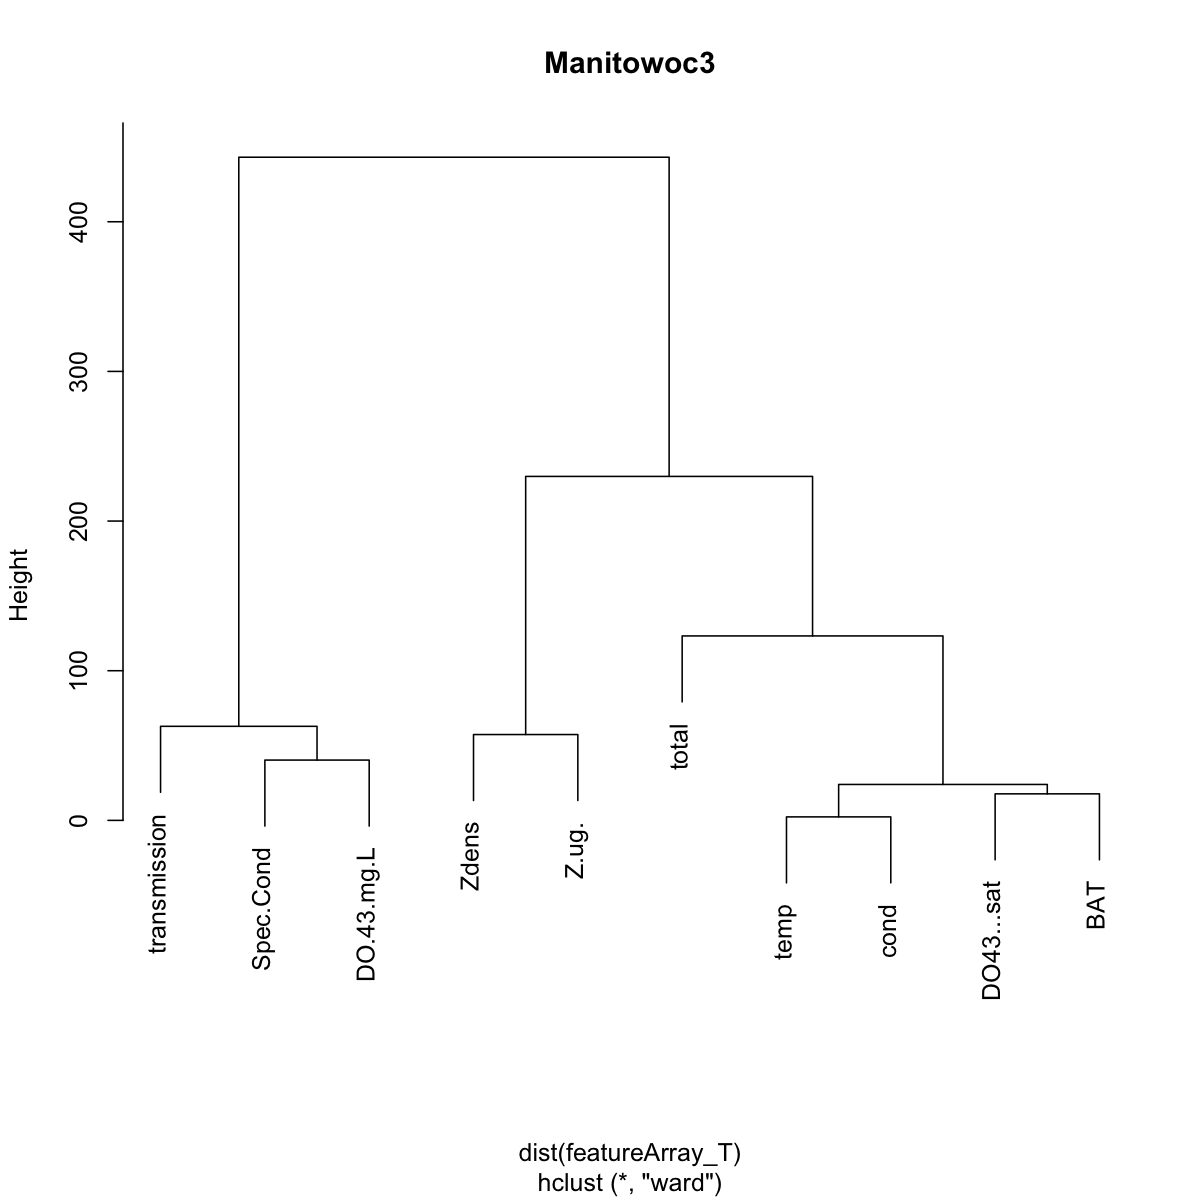
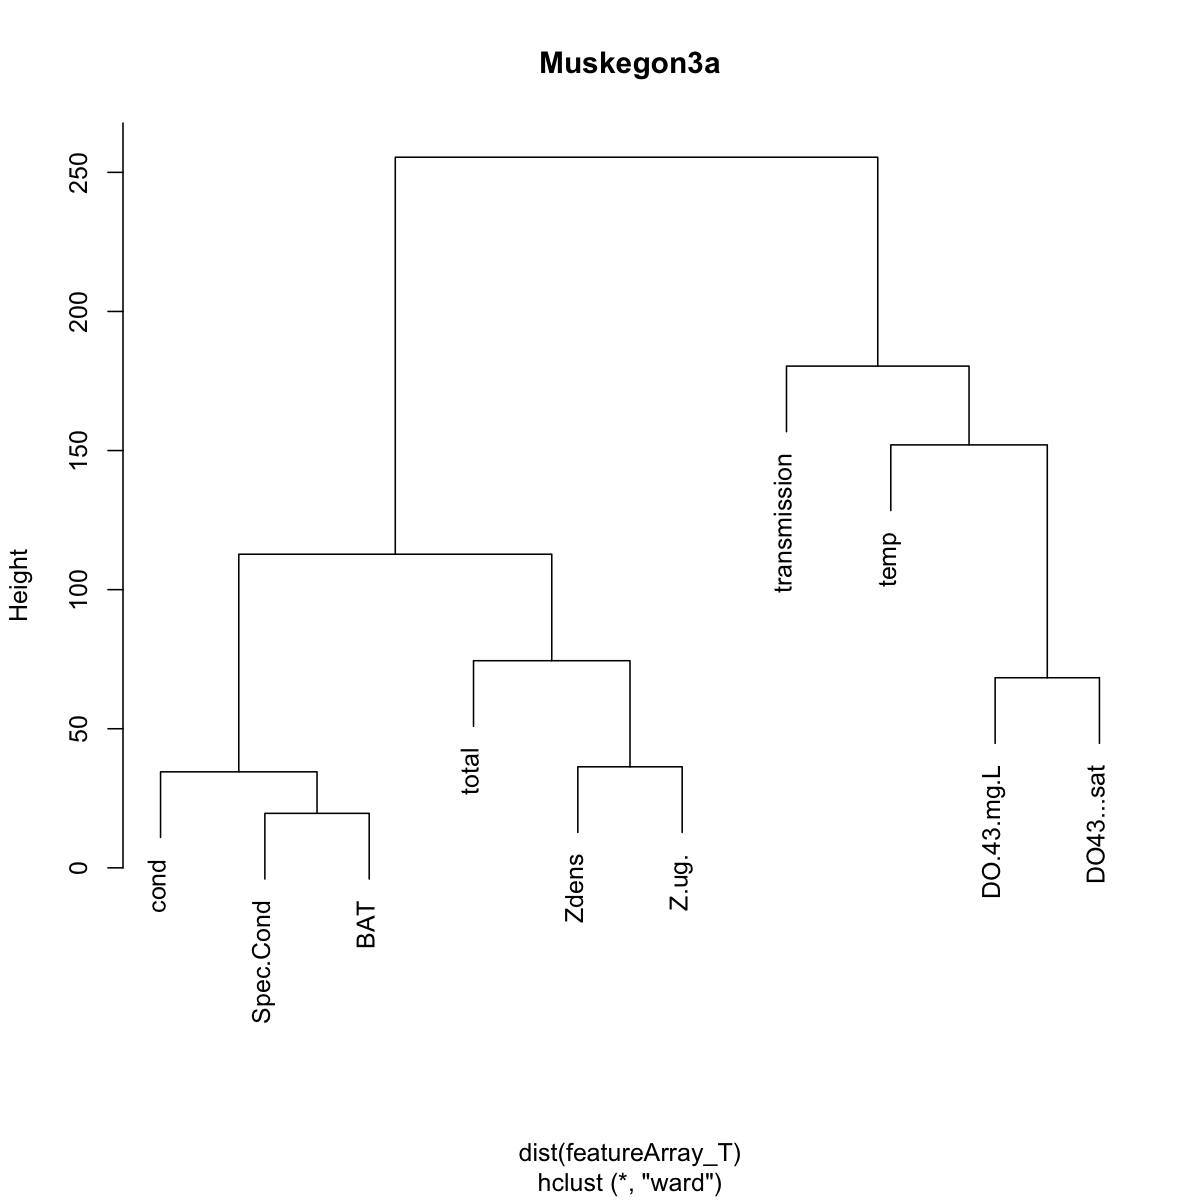
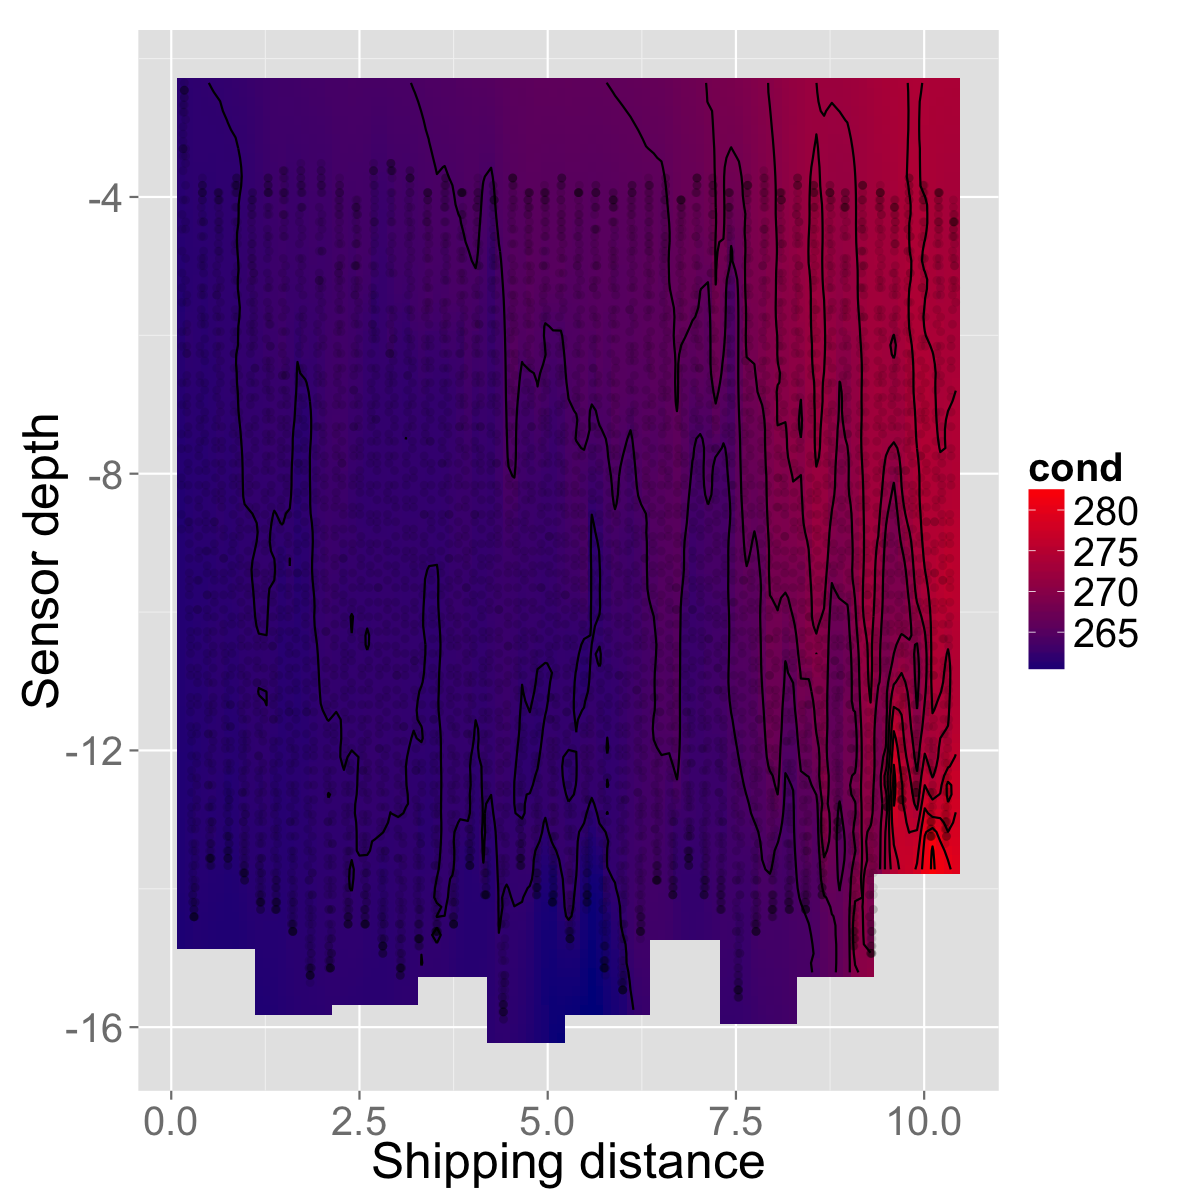
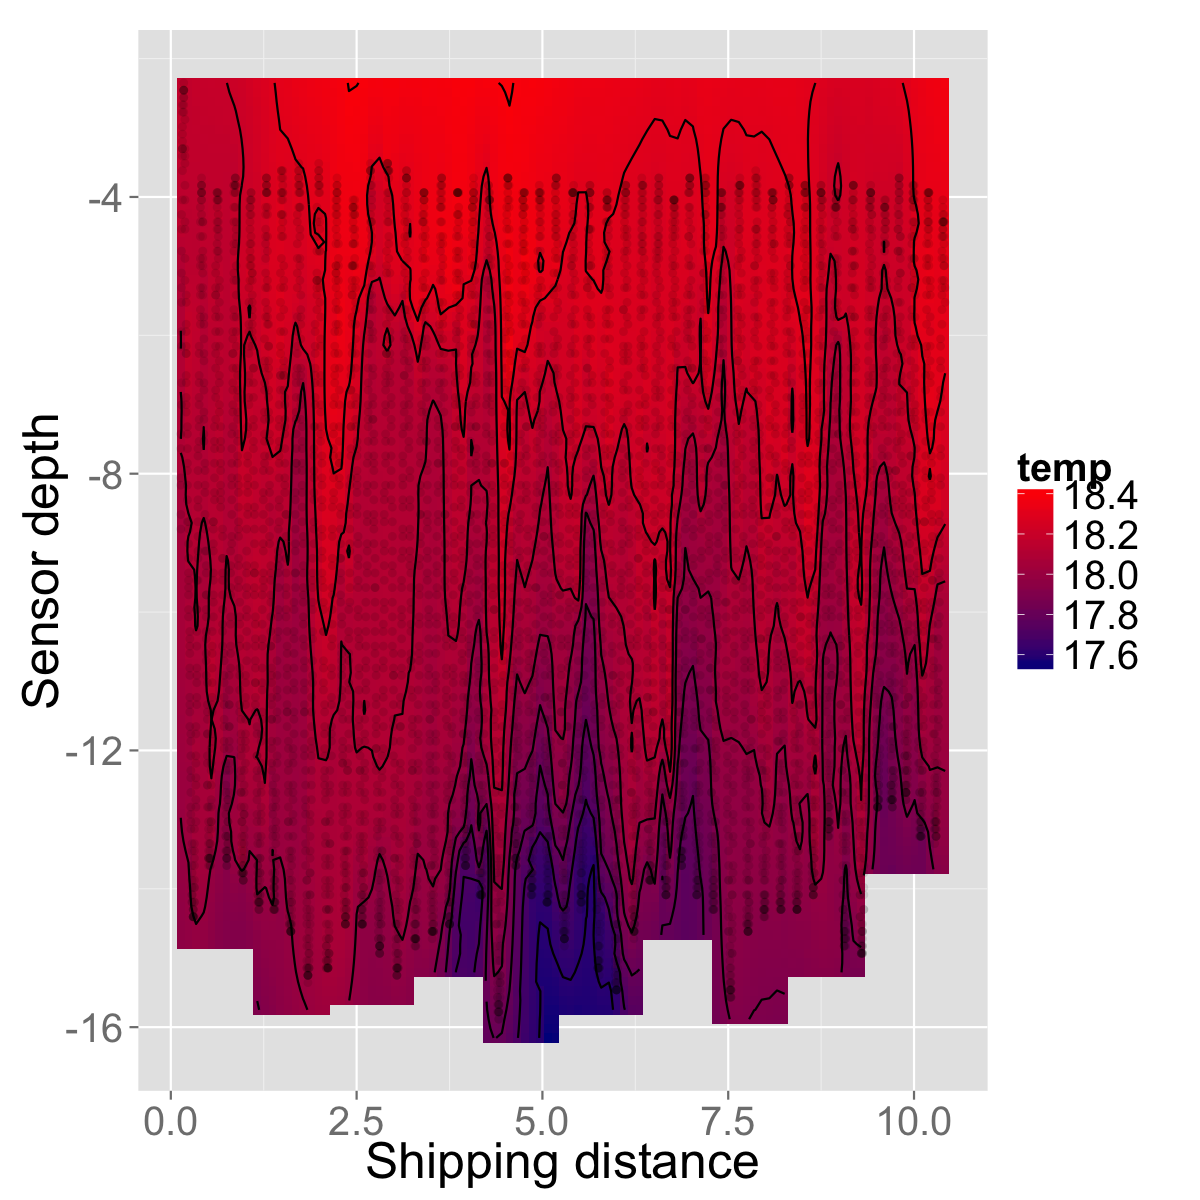
      Based on kriging result, I did Hierarchical Clustering to show the distribution similarity of 10 variables (temperature, conductivity, specific conductivity, BAT,transmission, total phytoplankton, zooplankton biomass, zooplankton density,DO, DO sat). Generally, temperature and conductivity, total phytoplankton and BAT and other pairs are in the same group. (i.e. they have similar distribution and highly correlated.) However, in Muskegon 3a path, clustering results shows temperature is not like conductivity, which is confirmed on the interpolation plot. And in Manitowoc3 path, total phytoplankton is different than usual.

          1. Hierarchical Clustering Manitowoc3.png
            75 kB
            Wenzhao Xu
          2. Hierarchical Clustering Muskegon3a.png
            77 kB
            Wenzhao Xu
          3. Muskegon3a cond krigResult.png
            591 kB
            Wenzhao Xu
          4. Muskegon3a temp krigResult.png
            648 kB
            Wenzhao Xu

              wxu15 Wenzhao Xu
              wxu15 Wenzhao Xu
              Votes:
              0 Vote for this issue
              Watchers:
              1 Start watching this issue

                Created:
                Updated:
                Resolved: