-
Task
-
Resolution: Fixed
-
 Normal
-
None
-
None
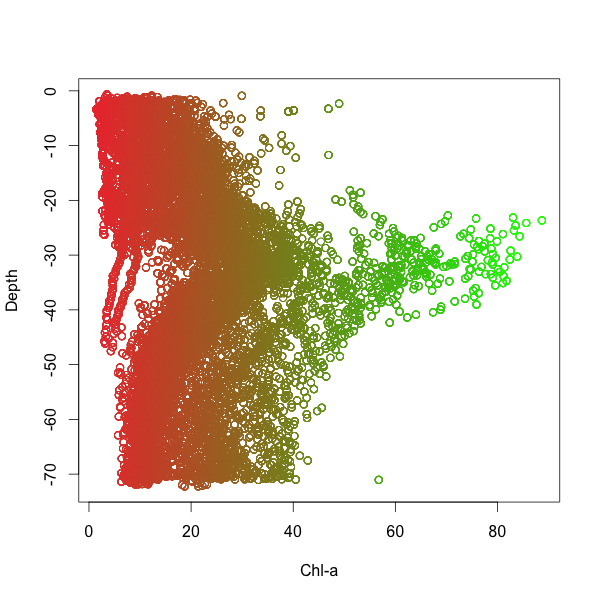
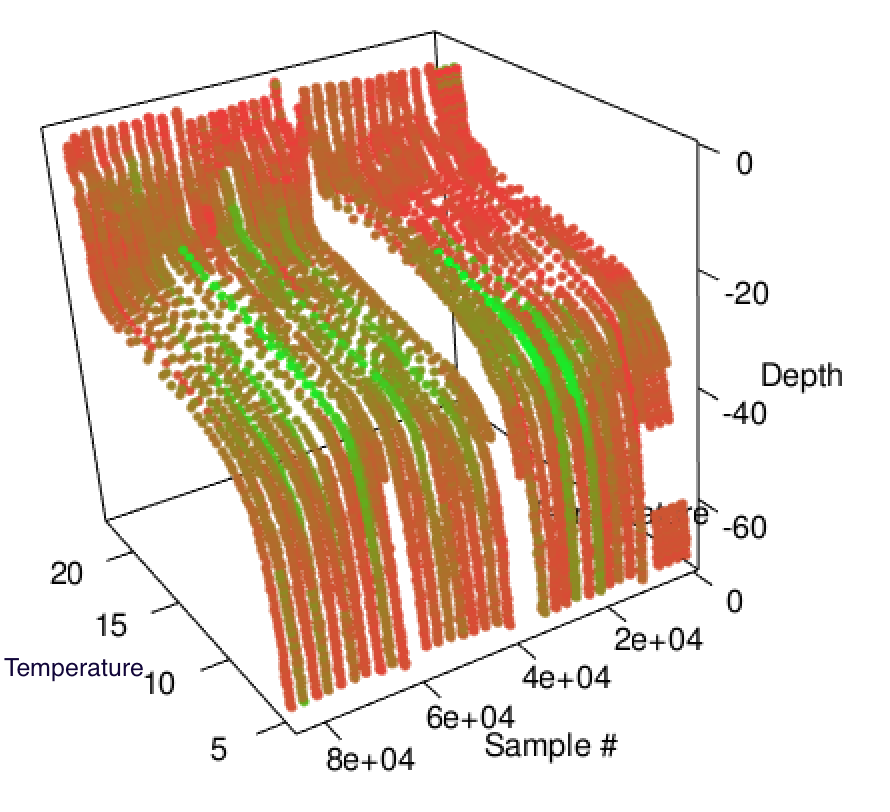
The figure shows the relations between depth, temperature and Chlorophyll values along different locations. Vertical axis is the depth, and the axis going deep is the temperature. Color represent the value of Chlorophyll, green is high, red is low.There is a thermocline around 20m to 40m depth, which is represented by the relative horizontal/flat curves. The high values, which are around 60 mg/L, is often located in the thermocline.
