Uploaded image for project: 'Great Lakes Monitoring'
  1. Great Lakes Monitoring
  2. GLM-12

Text for Trends graphic for Sensor data

XMLWordPrintableJSON

    • Icon: Task Task
    • Resolution: Fixed
    • Icon: Normal Normal
    • None
    • None

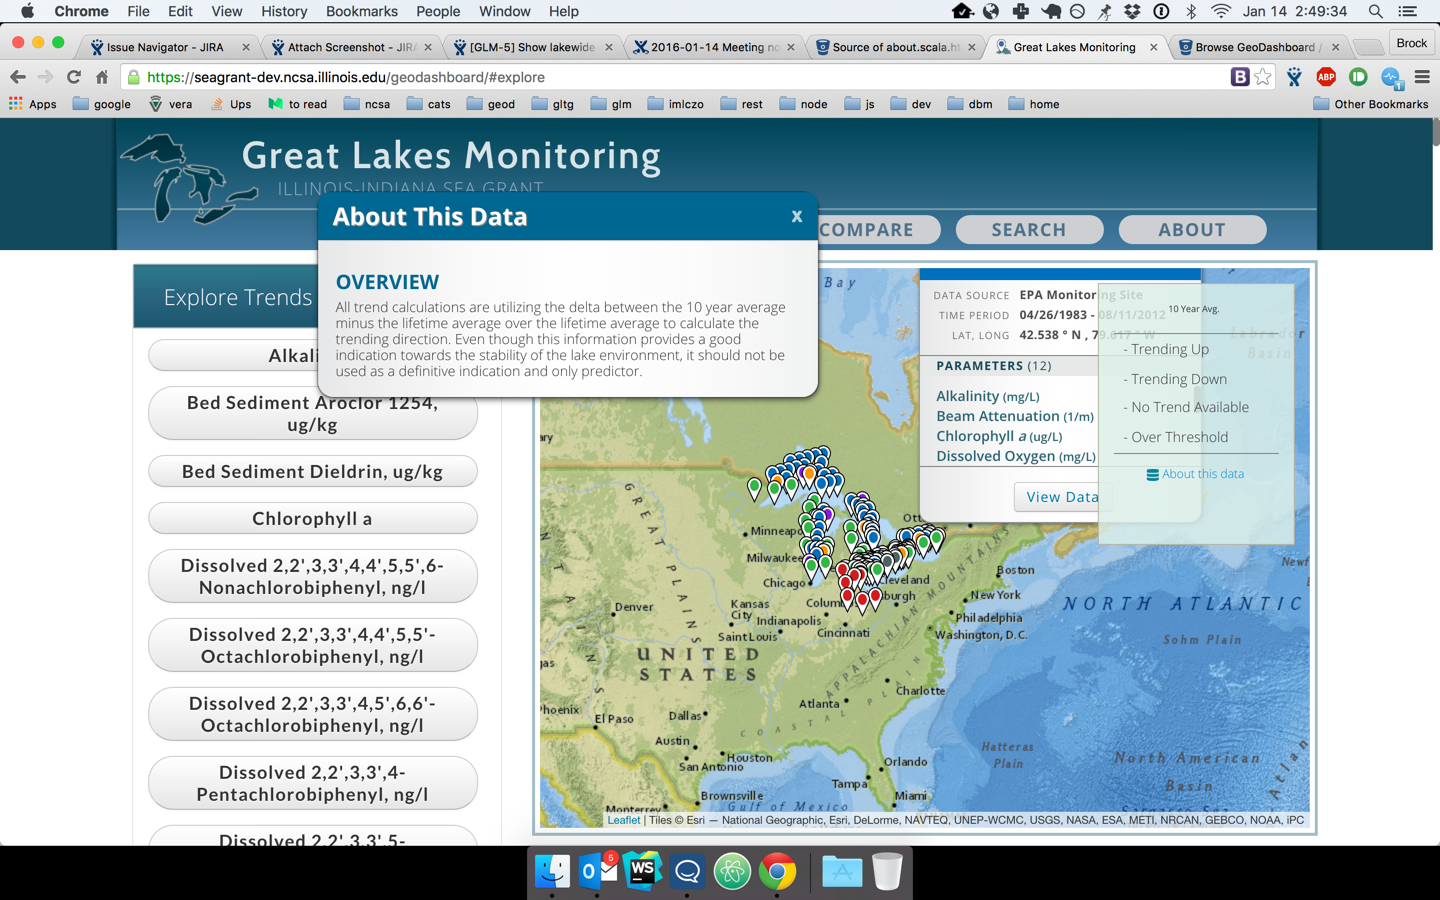
      Could you please add the text below to the iBox for Trends that provides how trends are calculated.

      *Trends based on sensor data are calculated using the average parameter value in the top two meters of the water column. Depth profiles for the entire water column can be found at the explore data link.

              eroeder Eugene Roeder
              ktepas Kristin TePas
              Votes:
              0 Vote for this issue
              Watchers:
              3 Start watching this issue

                Created:
                Updated: