-
Improvement
-
Resolution: Fixed
-
 Major
Major
-
3.0
-
None
From Omar:
Hi Nathan,
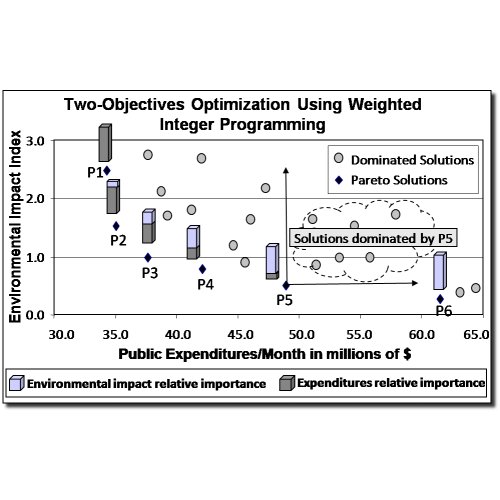
I had a meeting with Prof. Elnashai. He asked if we can show the pair-wise Pareto optimal solutions in the output graphs that MAEviz draw for the temporary housing model. I will give you some more explanation:
Currently we show all the optimal solutions in each graph. Hoever, we can also highlight the optimal solutions in terms of the only the two objectives on the a-axis and y-axis. An example is shown in the attached Figure. On the left handside you will find three graphs similar to what MAEviz generate, but they also highlight the pair-wise Pareto optimal solutions.