Summary of Methods & Approaches for QA/QC and Adaptive Sampling
Spectral Methods
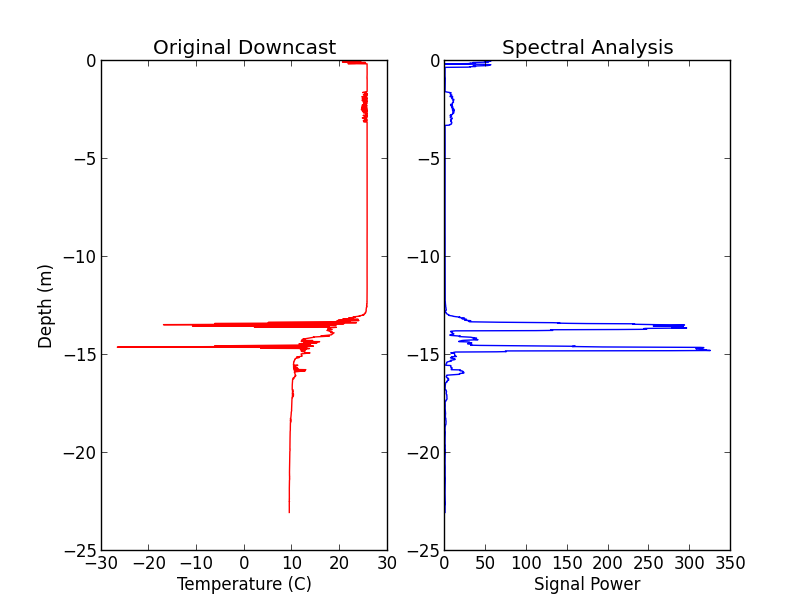
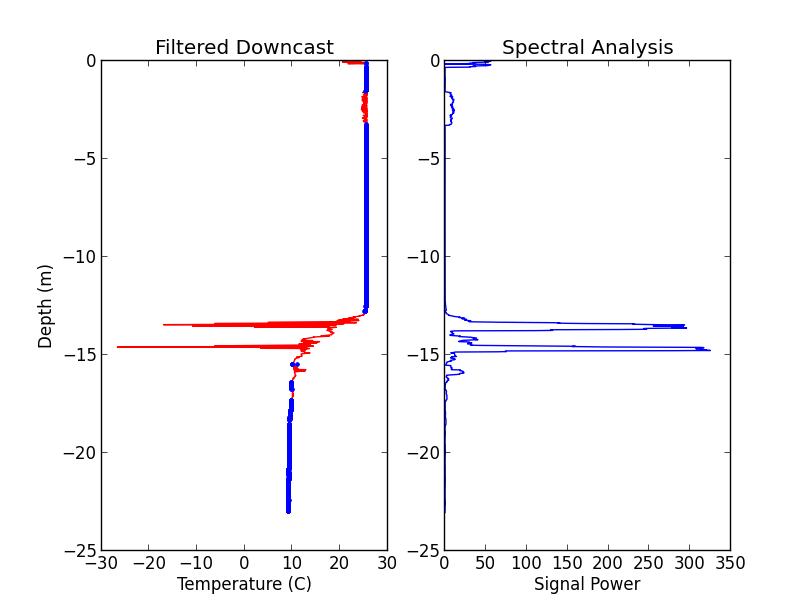
The basis idea: observe a rolling window of signal and run a fast Fourier transform. After computing the power spectrum, we sum the coefficients to obtain the total signal power. During abrupt changes in the signal, more high frequencies come into play and the signal power spikes. If we assume the presence of high frequencies is indicative of noise, then we can throw out these samples without losing any information.
Conversely, we can also assume the low signal power is indicative of the true signal (i.e. stability). By identifying these stable samples, spectral analysis can be used to bias input used in other approaches, such as importance sampling (below).
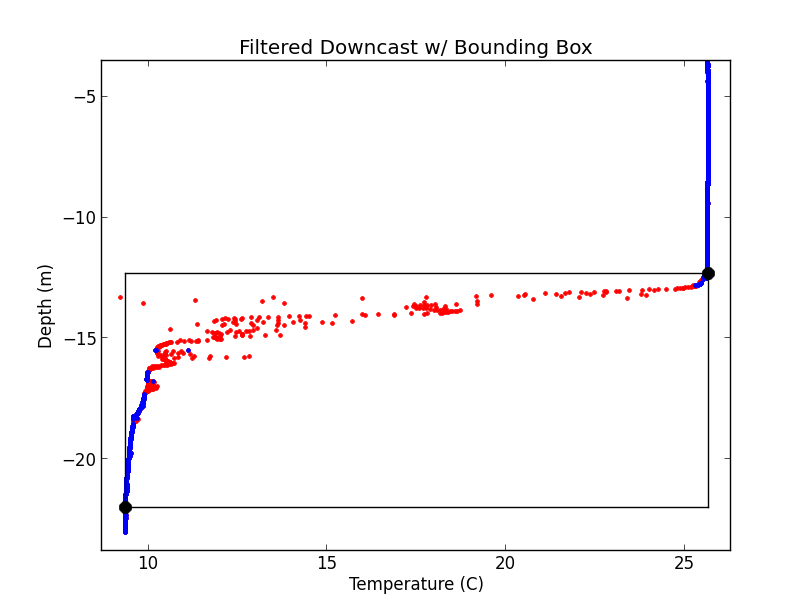
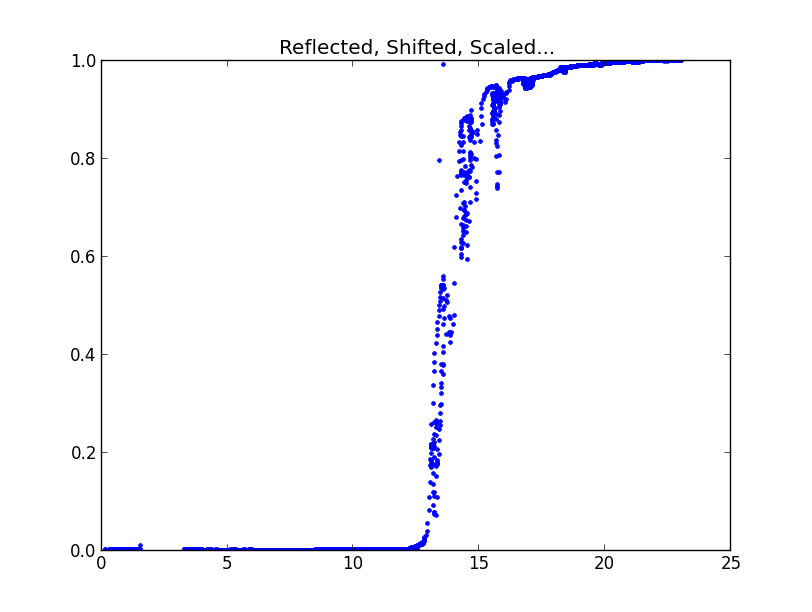
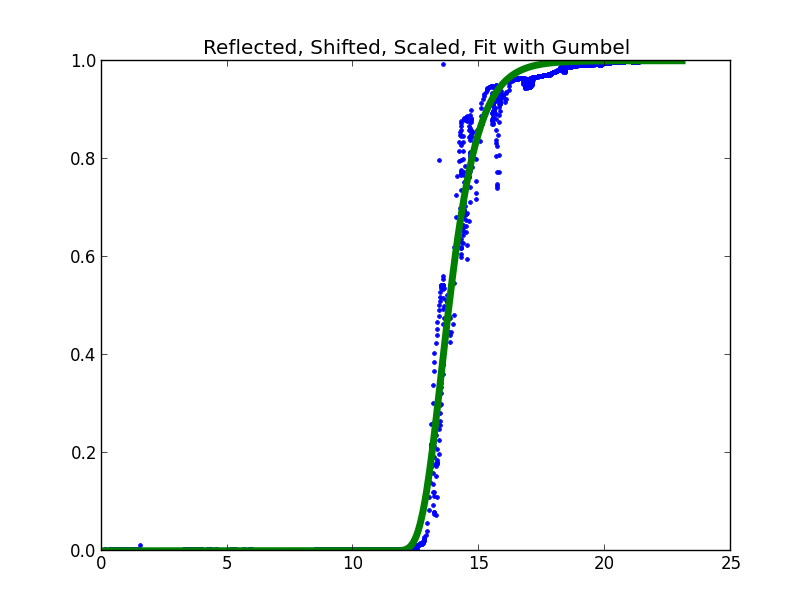
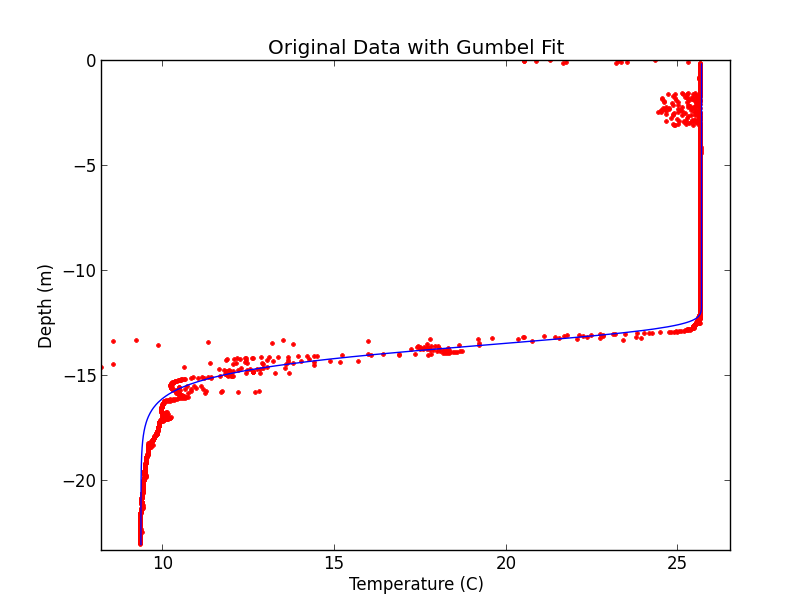
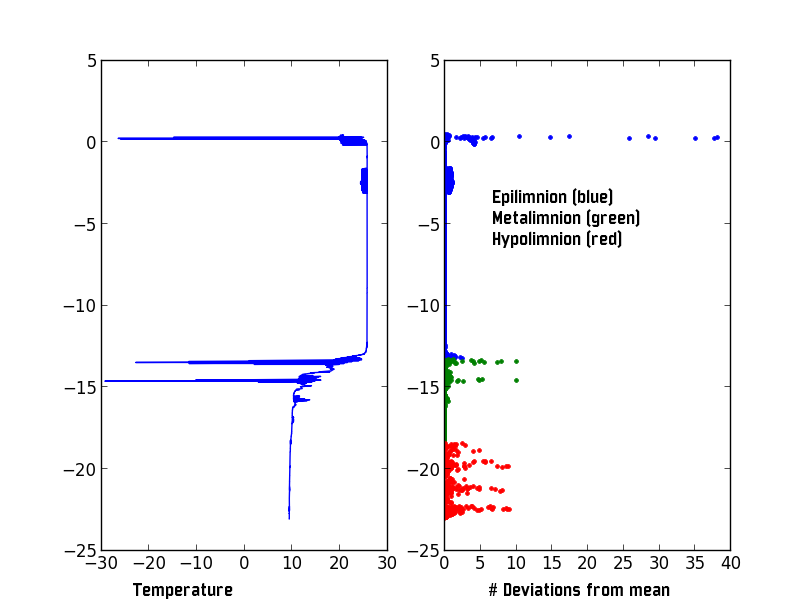
Approximation of the Metalimnion using Probability Distributions
One of the few methods I found in literature regarding QA/QC of temperature profiles used a curve fitting approach. The specific curves were drawn from probability distribution functions. The thermal data was from oceanic downcast data.
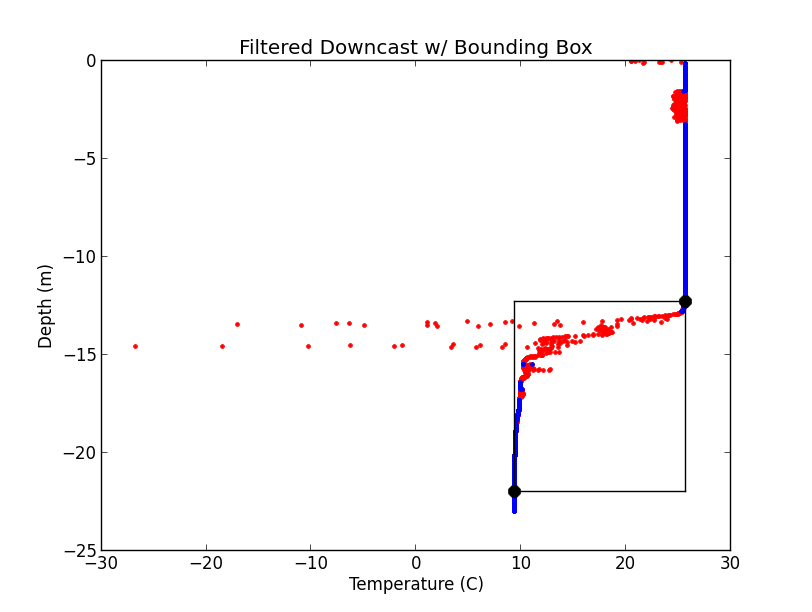
Importance Sampling
Hidden Markov Models
Baum-Welch Algorithm Adapted for Iterative Cleaning
x
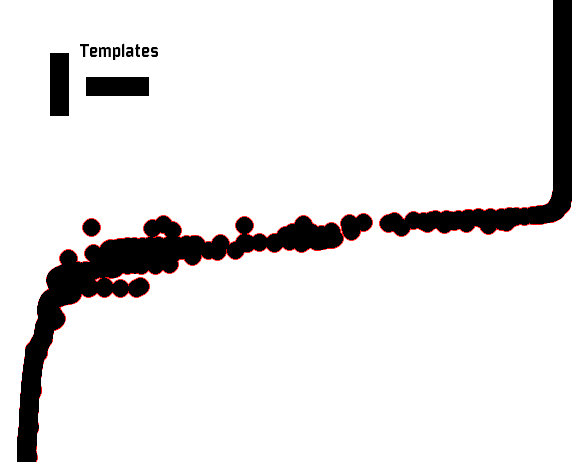
Matched Filtering for Improved Situational Awareness
Summary of Triaxus Data
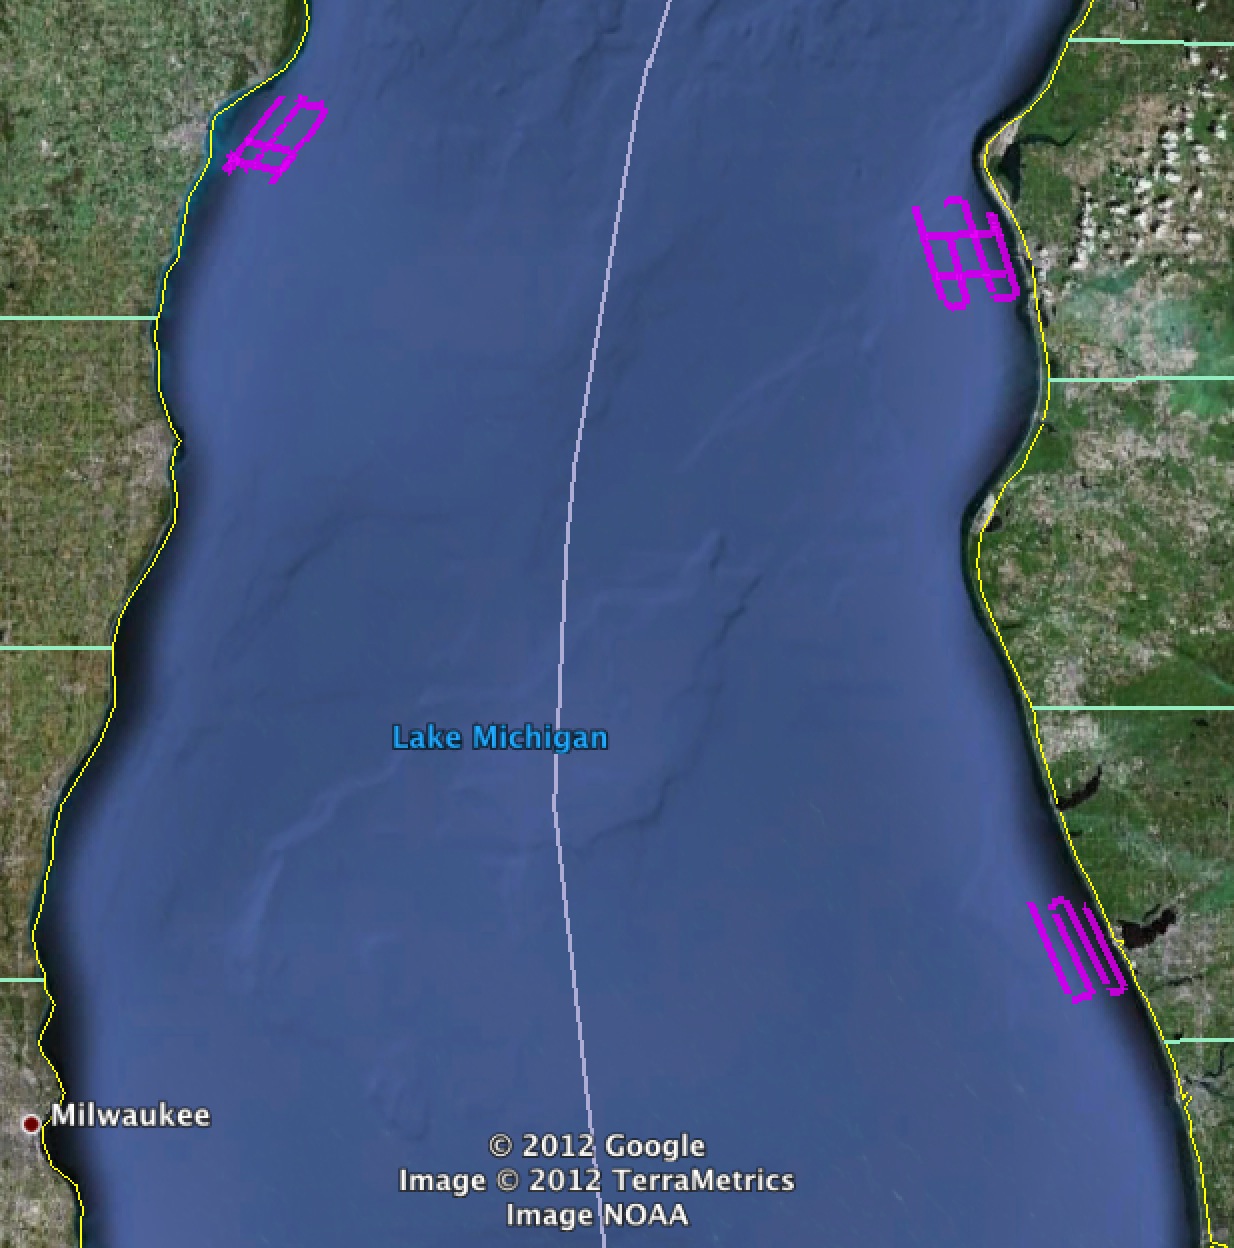
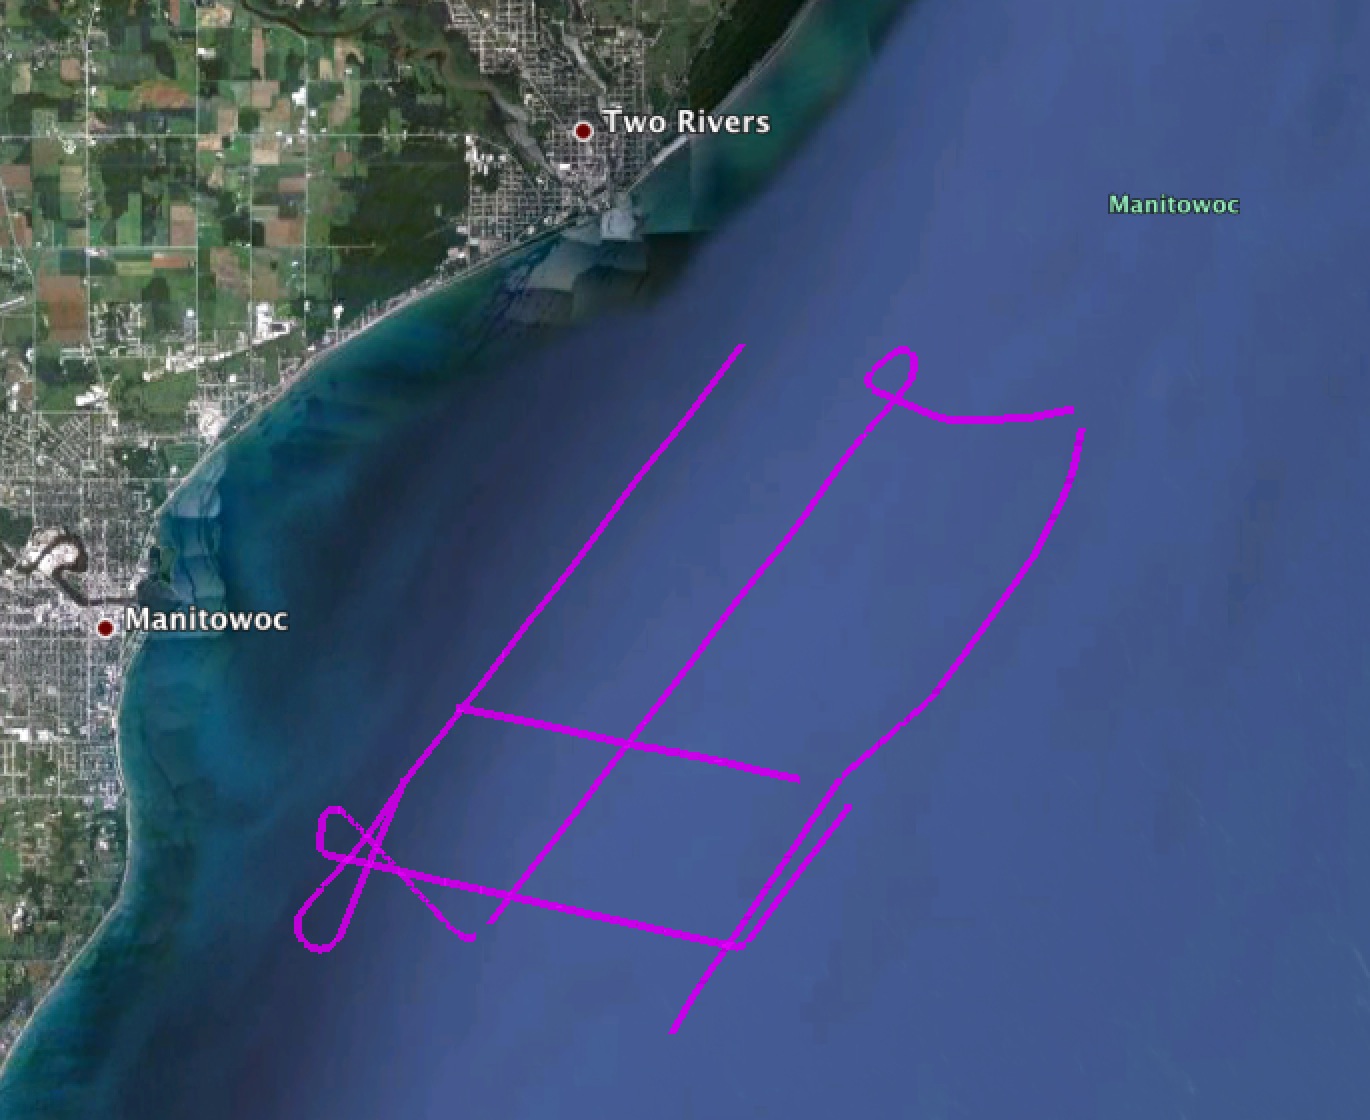
Trip Route
File: (TriaxusTrip.kml)
Currently, the Triaxux Data was gotten from 3 locations. For each location, it has data sampled from routes parallel to the coastline and vertical to the coastline.
Interesting Features to be discovered
Thermocline
Deep chlorophyll Layer or Deep chlorophyll maximum: The region below the thermocline and is represented by a broad band of increased chlorophyll concentrations.
plume
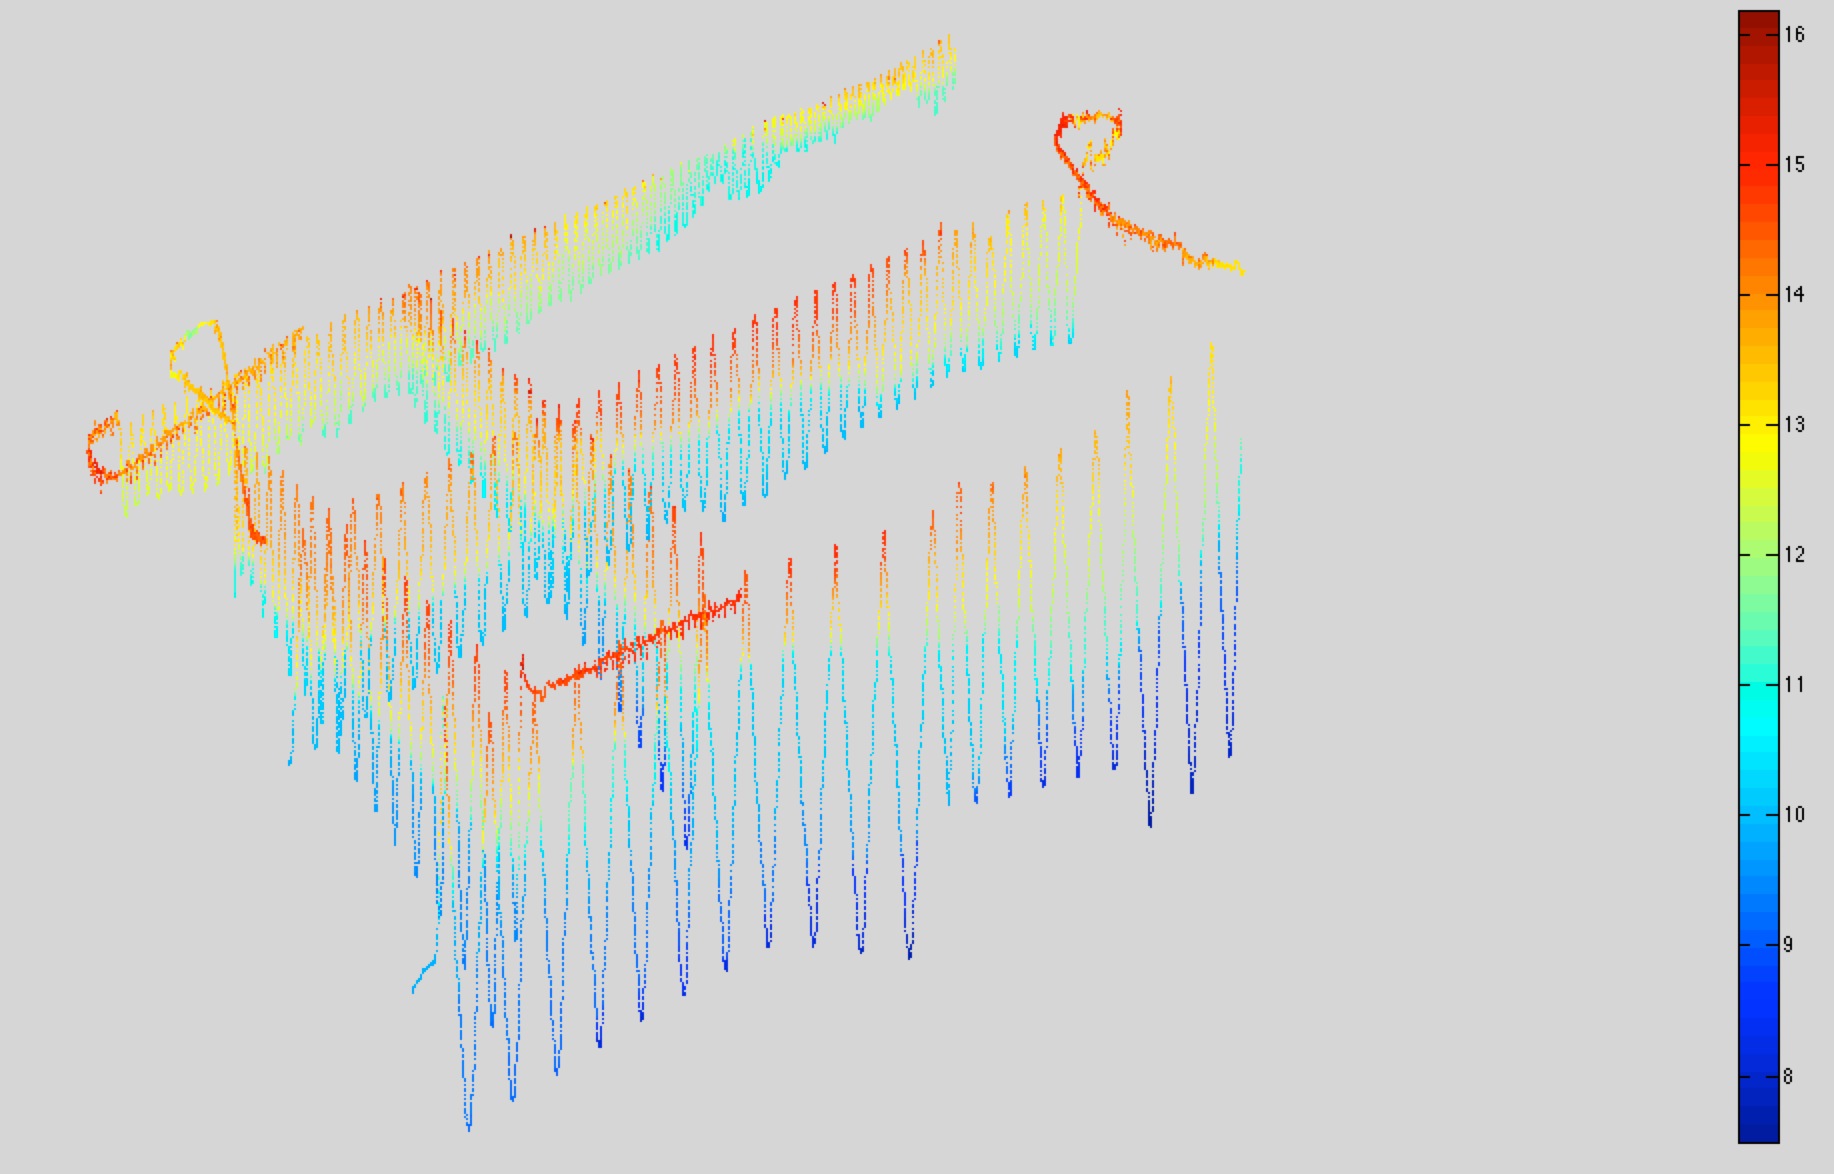
Data Visulization
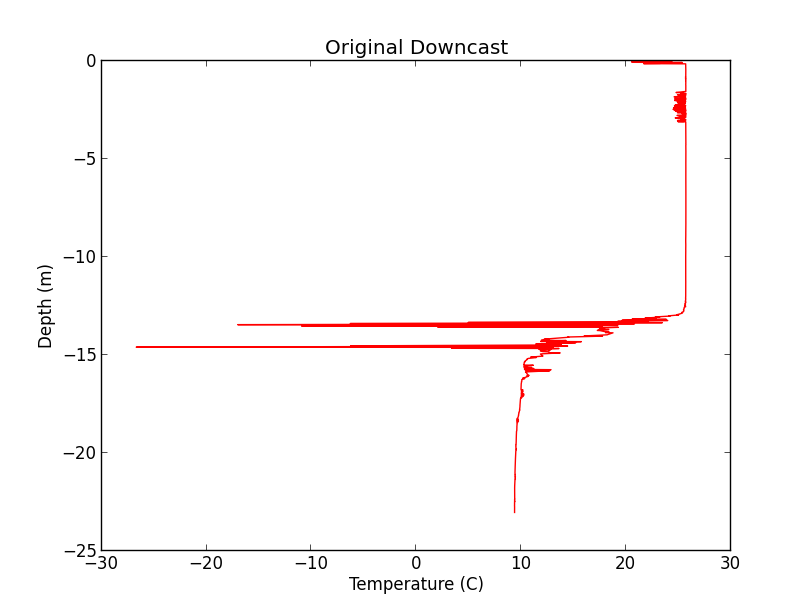
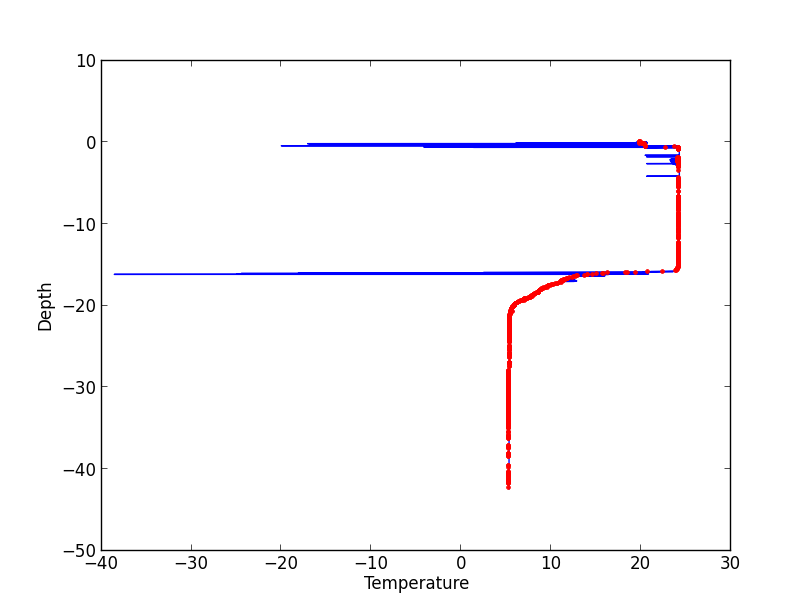
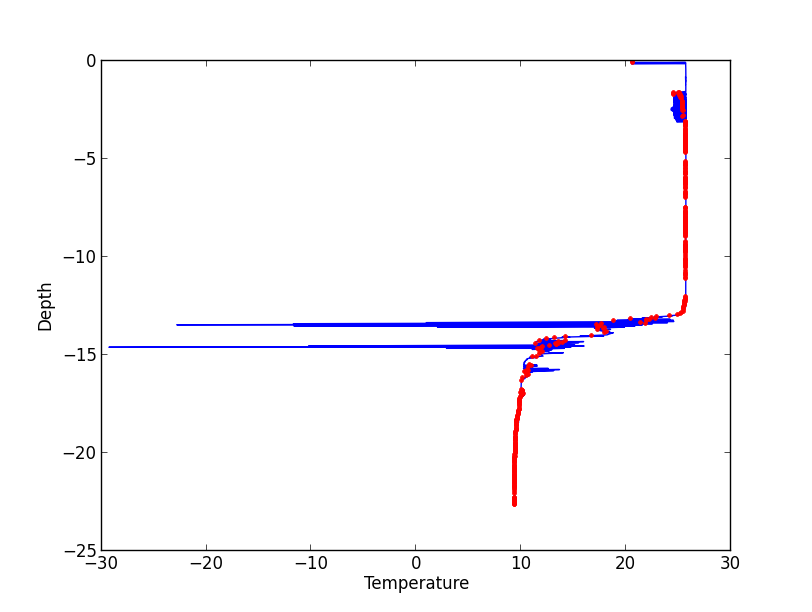
For data in Manitowoc and Two Rivers city, the temperature along the depth is:
Data Interpolation
Since the data is a 4-d data (lat, alt, depth, and time). First, to interpolate in a plane (Distance vs Depth) using anisotropy interpolation technics such as Kriging.
For each site, first do the kriging interpolation on the plane parallel to the coastline.
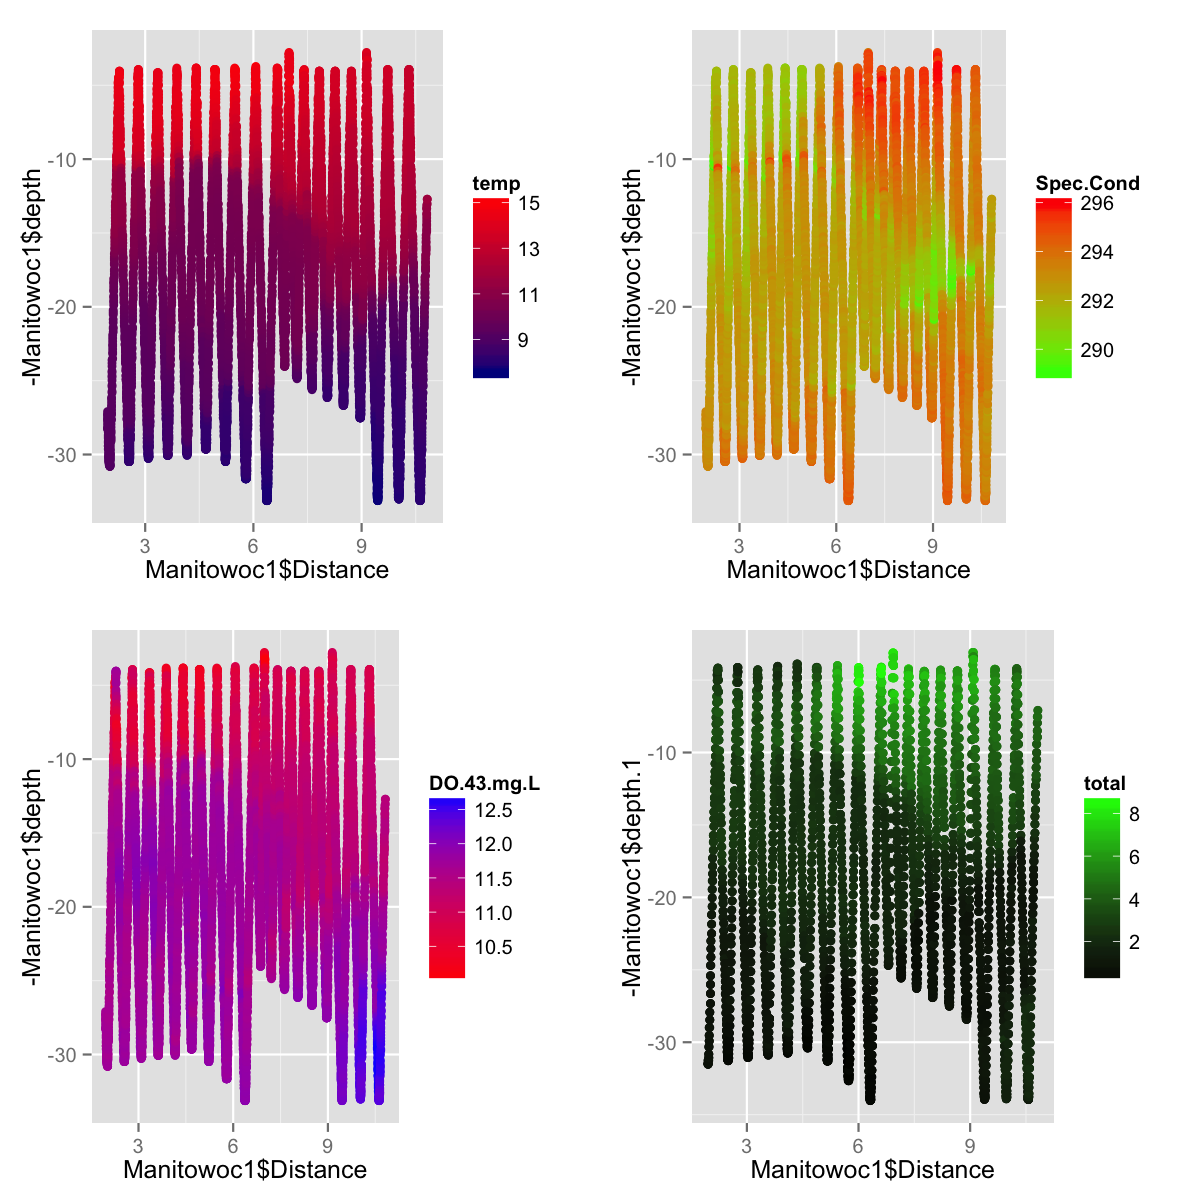
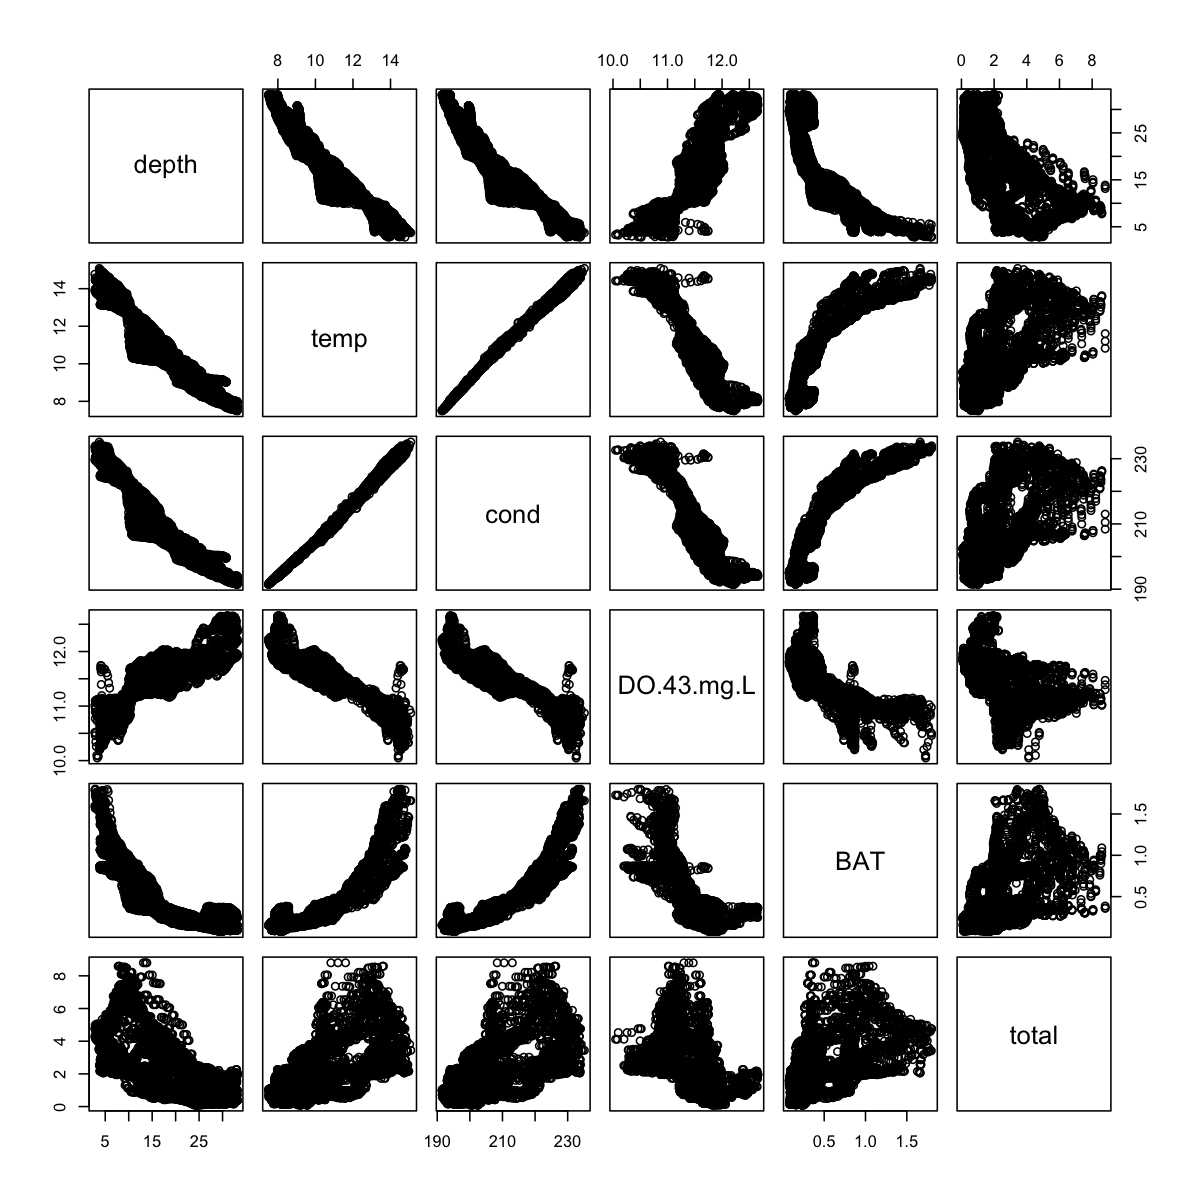
File Manitowoc_01, the general conditions about temperature, Spec.Conductivity,DO and total phytoplankton is:
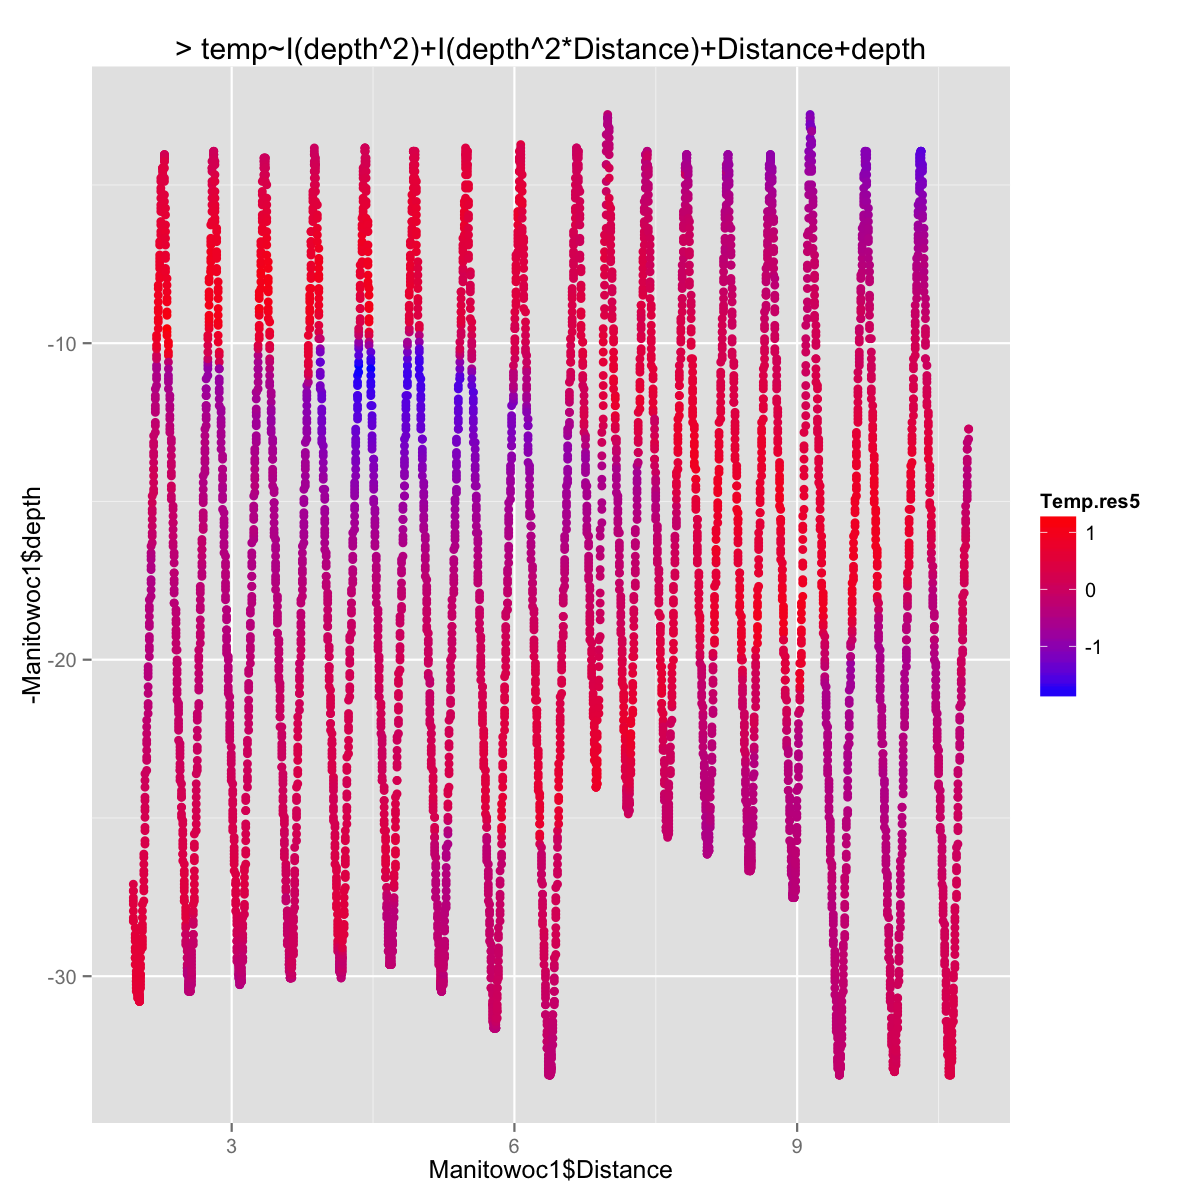
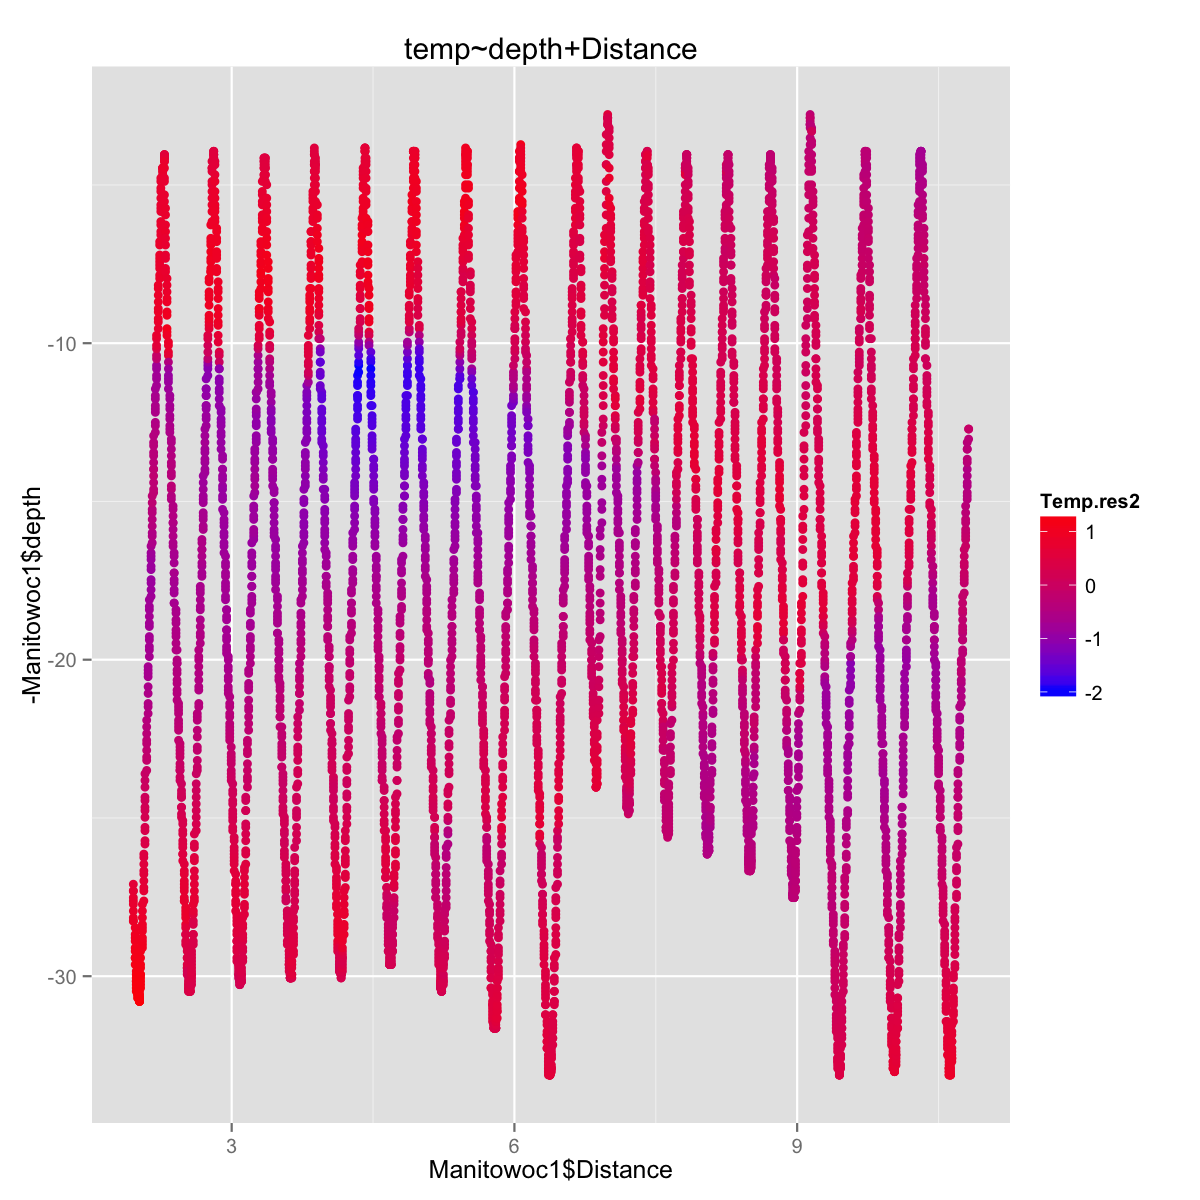
In order to do kriging, trend need to be detrend.
Test different detrend functions:(1) temperature~depth, (2) temperature ~ depth+I(depth^2)...... Plot the value of residues to see whether it has been detended (The residual should satisfy normal distribution)
Then, adjust the unit of "Distance" and then try to find the some adjust factor that makes us to do geometric kriging interpolation, otherwise, do zonal kriging interpolation.
Finally, do kriging interpolation
(1) Hill, D.J., Minsker, B.S., & Amir, E. (2009). Real-time Bayesian anomaly detection in streaming environmental data, Water Resources Research, 45, W00D28, doi:10.1029/2008WR006956.