Data Types collected by Triaxus

Note: Sample Triaxus data files are attached to this page; click the paperclip icon in the upper left corner of the page to access the data sets.
The Triaxus unit is a platform that hosts a number of different sensors. The table below is based on a review of the "Explanation of TRIAXUS Data File.xlsx" file where the data sections are color coded to distinguish between the different sensors installed on Triaxus.
| Categories | Types |
|---|---|
CAT 1 (blue) – ship location data
|
|
CAT 2 (pink) – Depth Data
|
|
CAT 3 (green) - general seabird-like data (horizontal)
|
|
CAT4 (purple) – Chlorophyll Data from BBE Fluoroprobe
|
|
CAT5 (salmon) – Phytoflash device
|
|
CAT 6 (grey/tan) – Laser optical plankton counter (LOPC)
|
|
CAT 7 (red) – plankton density
|
Z(ug)<5 |
CAT 8 (orange) – actual size of particulates
|
|
Data Subsets, data products
TBD.... In general, consumers are interested in the data w.r.t. time and interesting events. For example, open water yields flat lines (very few deltas), where areas with upwelling and/or river mouths show more interesting data (x axis should be time.)
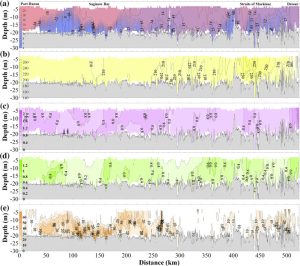
Visual representations will be similar to those described in: Yurista_et_al_2012.pdf. Sample visualizations include:
| Isopleth contours (depth, distance, values) | Specific parameter values over distance |
|---|---|
| 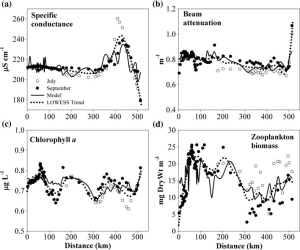 |