This iteration of the designed defines an approach for dynamic content definition resulting from a search and page template perspective. Given the large collections of scientific data, this approach provides the community an ability to search data easily and select a result display from a list of predefined templates. While the templates are relatively static within the system, appropriate members can customize and add new layout templates to meet their needs. The following sections describe the templates, search and potential data views that will be built for the user community based on use case scenarios.
Page Templates
This approach will provide the user community a variety of templates to present their data and tell their story. The results of a search should allow users an ability to select a template and populate it with the appropriate data from the search. These pages can be use for both user specific queries or as official site pages. In the case of user specific pages we anticipate a user can save their query and reference it from a shortcut in the future. In the case of site pages, site administrators or domain experts can generate specific queries and save them as part of the site using the page templates and navigation editor. Below are a few examples of example templates.
Next steps:
- define the page atoms/elements (nav list, free txt, embedded image, graphic, etc..)
- define basic templates (main, featured, search, etc...)
- define process so users with HTML/CSS/JS experience can create new templates using tools like Dreamweaver.
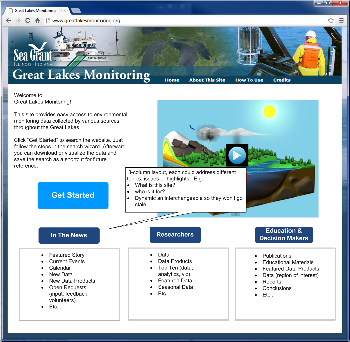
Main Page
| The goal of the new Home page is to provide quick access to relevant site resources. A 5 zone approach will provide: 1) An upper 2 column layout to include:
3) A lower three column layout to help the user quickly access information in specific areas or formats. These could include:
To keep the site interesting and prevent it from going stale, the data provided in each zone will need a simple 'change' interface to allow site admins to edit, add/delete content which includes the welcome paragraph, the bullet lists items/links and the featured graphic/link.
|
|---|
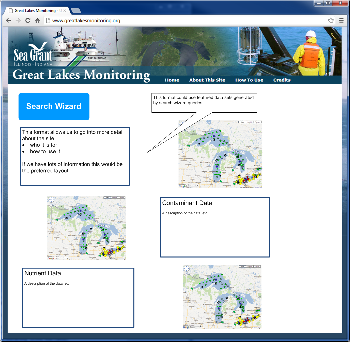
Alternate Pages
Case 1:
Case 2:
| The alternate pages could provide:
Case 1 provides users access to particular data collections, e.g. Contaminate or Nutrient Data for a particular region of interest.
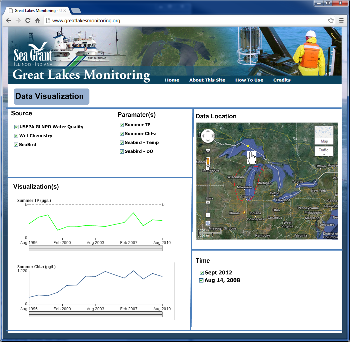
Case 2 shows how a users search result could be used as a site reference to specific data for a particular region, time frame and data visualization type.
Since this page is a direct result of a user's search, the resultant URL can be saved and linked back to the site. These search result pages are also intended to be saved as short cuts on a user's browser or could be embedded in to other site using an <iframe> tag. <iframe src="http://www.greatlakesmonitoring.org/dataSource/region/time/dataTypes/resultLayout"> |
|---|
Search Wizard
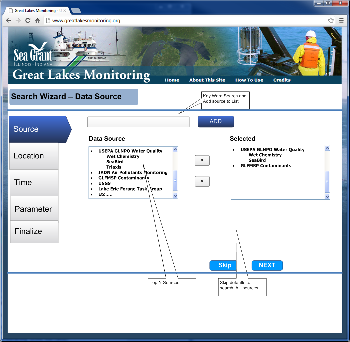
The intent of the wizard is to walk the users through each step needed to define a query. To keep the interface simple we'll provide distinct interfaces for:
- Data Source (EPA, USGS, NOAA, etc...)
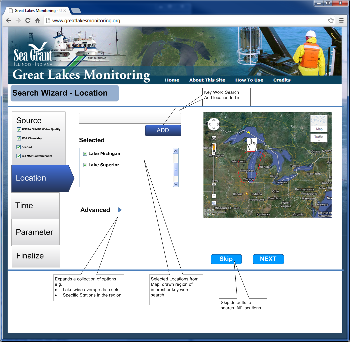
- Location (Region of interest, point on map, area drawn on map, or predefined regions like Lake Michigan)
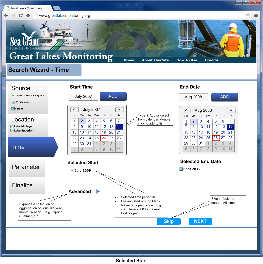
- Time (Start, End)
- Parameters (context sensitive data, specific types, data collections like nutrients, or all available data)
- Result Output (finalize page that provide download options (csv, json, etc...), visualization types and a URL for future reference.
The layout for the search wizard provides:
- Wizard navigation is located on on the left hand side to allow the users to easily move between each input parameter.
- As the user defines search criteria, they appear under the respective input field allowing for quick inspection as the user moves through the wizard.
- If no inputs are selected for an input page then the wizard assumes "all" for the respective input page (data sources, locations, times, and data types)
- As user defined search criteria, the respective inputs become context sensitive so only relevant data will appear to reduce the clutter of irrelevant data and help reduce the choice complexity for the user. For example, if the user chooses the source EPA, and Lake Michigan, only data types relevant to those search inputs are made available to search.
Data Source
| The search wizard provides the following capabilities: Data Source
|
|---|
Location
| Location can be defined by a couple of methods:
As ROIs are defined they appear in the Selected box and can be 'unchecked' or deleted if the user wants to remove them from the search. If a user defines a new ROI (point, polygon), they should be prompted to provide a name and in the case of a point, define a radius. These new ROIs should be saved so users can use them as future ROI reference. Q: Who has this creation authority: Trusted Users vs. Anonymous ? Advanced: These options would allow for additional inputs like:
|
|---|
Time
| Time is limited to a single "Start" and "Stop" time and can be defined in a couple of ways. The user has a free form input field, a calendar select view and a clearly defined Start and Stop field.
Advanced: |
|---|
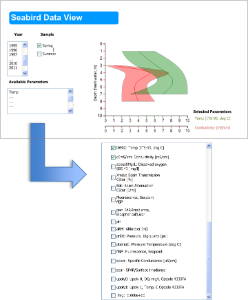
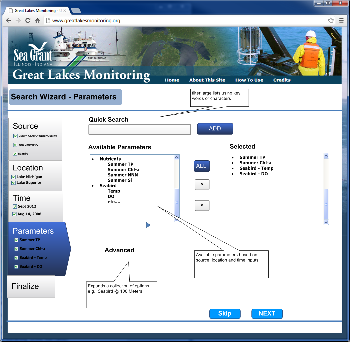
Parameters (Data Types)
| The parameters page has a similar layout to the other pages and provides access to the relevant data types for the defined source & ROI. Quick Search: an area where users can type to filter the current list or search for specific data types. Available Parameters: a list of the available data types Selected: the list of specific data chosen by the user Advanced: Some data types will have advanced options. For example, Seabird data provide an additional depth capability. e.g. Seabird data @ 100 meters |
|---|
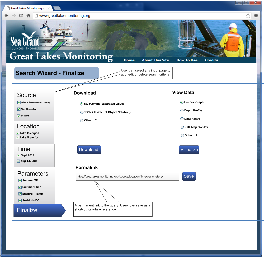
Result Output / Finalize
| This final page provides the relevant (context sensitive) options for downloading and visualizing the data.
Download: provides the relevant file formats to download the data. We anticipate, .cvs, .json, .kml and others as driven by community requests
View Data: provides the users a choice about how they want to see the data. Current data views include:
Permalink: This the URL the user can save to this page for future reference. Discuss: When they come back in the future, can/should they be able to change any of the search parameters to generate a different result? The use case would be a quick start to explore, add, edit, delete the various options without starting a new search. |
|---|
Search Result
| The search result page provides a quick reference to the data, location, time and selected visualization tool. This page URL can also be saved for future reference. |
|---|
Data Views
Box Whisker
| Box Whisker | Data Range (Quintile Plot) |
|---|---|
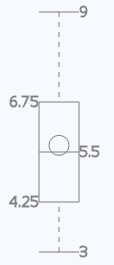 |  |
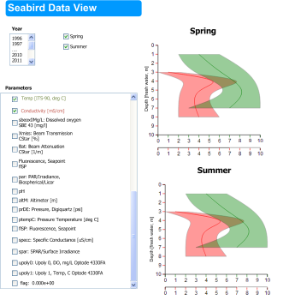
Depth Profile Visualization
The depth profile tool will provide a view to vertical column of data collected by Sea Bird. Initial mock-ups include:
| Depth Profile | |
|---|---|
Single Data Set | Multiple Data Sets
|