Instructions for Installing and Executing the Triaxus R script on a windows machine
Steps
Install the latest version of R from http://cran.r-project.org/bin/windows/base/ with default settings. Under the default settings, R should be installed in the "C:\Program Files\R" directory.
Run R in interactive mode by executing R.exe as an Administrator. It would be available at "C:\Program Files\R\R-3.1.1\bin\R.exe" and install the various necessary packages by entering the following commands in the command prompt:
install.packages("ggplot2",dependencies=T)install.packages("gstat",dependencies=T)
install.packages("moments",dependencies=T)
install.packages("fields",dependencies=T)
install.packages("GA",dependencies=T)
install.packages("spdep",dependencies=T)
install.packages("rgeos",dependencies=T)
install.packages("fields",dependencies=T)
install.packages("gWidgets",dependencies=T)
install.packages("gridExtra",dependencies=T)
install.packages("dismo",dependencies=T)
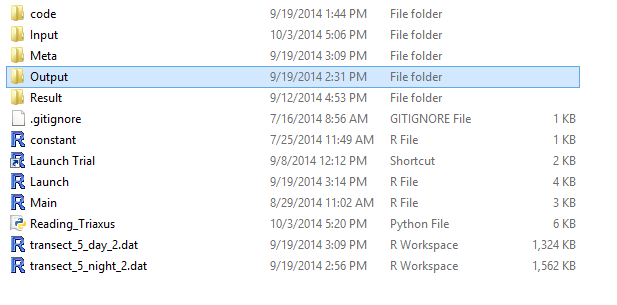
- Download the code from https://uofi.box.com/s/g354lm5av36uz0v27q75p970k1fz83gz5cyn3n3h Extract the zipped folder and you should be able to see the contents as shown below.

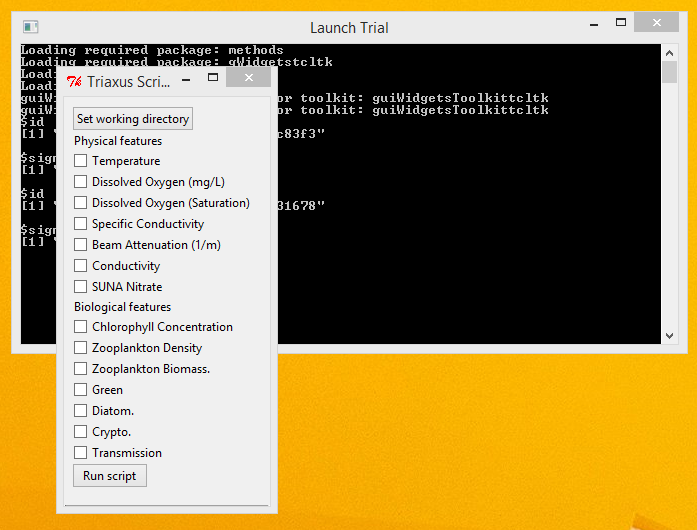
Execution - Execute the application by double clicking the 'Triaxus ScriptLaunch Trial' shortcut. You will see an interface as shown below.

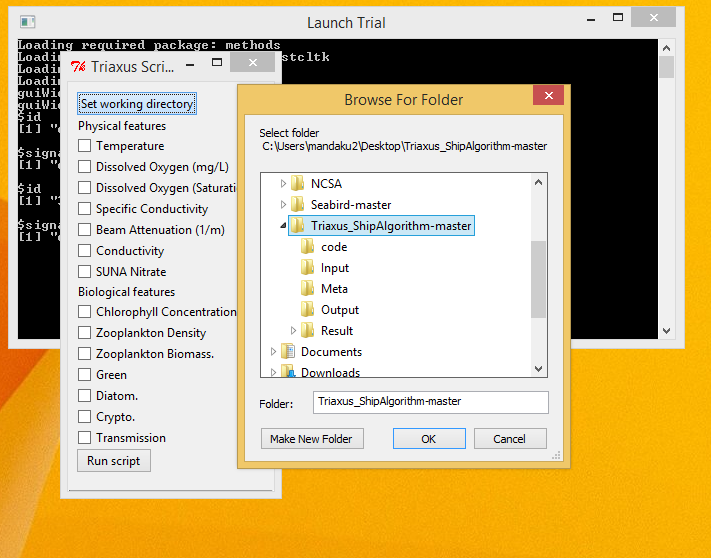
- Select the main directory for the application where all the files exist as the working directory, by clicking on the Set working directory button.

 Choose
 - Copy all the data file to be used by clicking on the browse button to choose an appropriate source data file.
 files to the 'Input' folder of the Triaxus script directory.
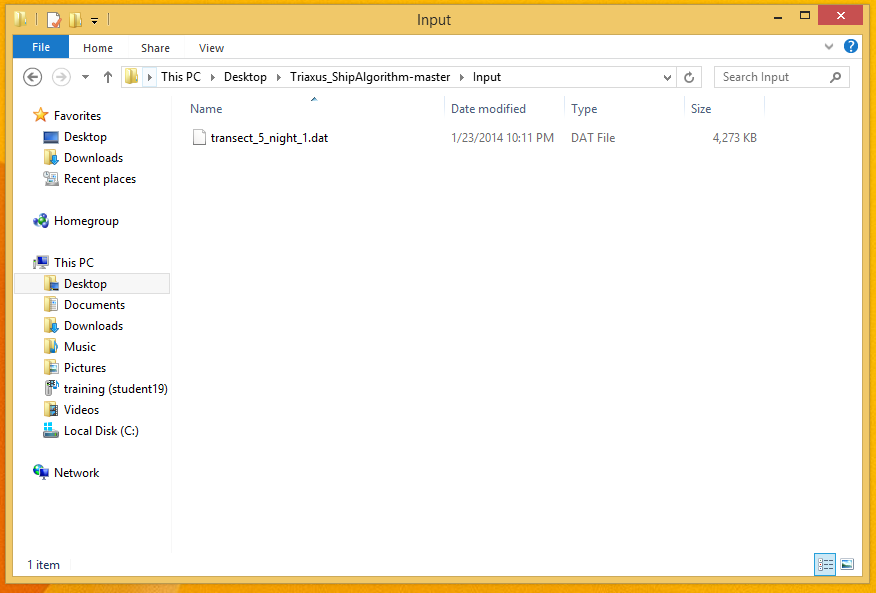
- Select the various Physical and/or Biological features that you want the script to consider, by checking the appropriate boxes adjacent to each of the features.

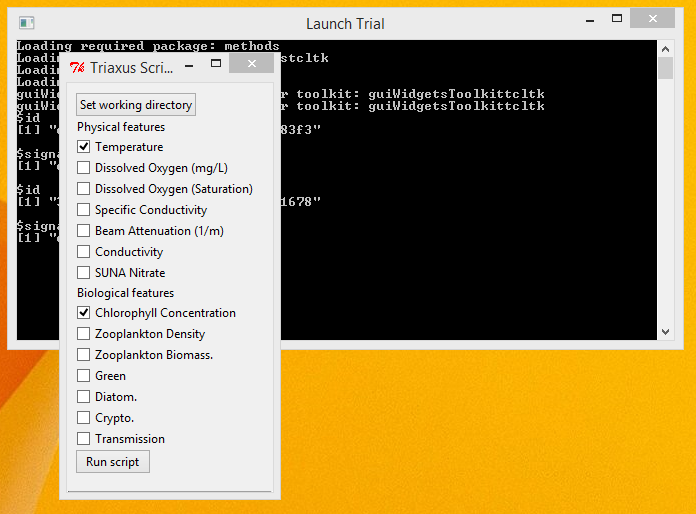
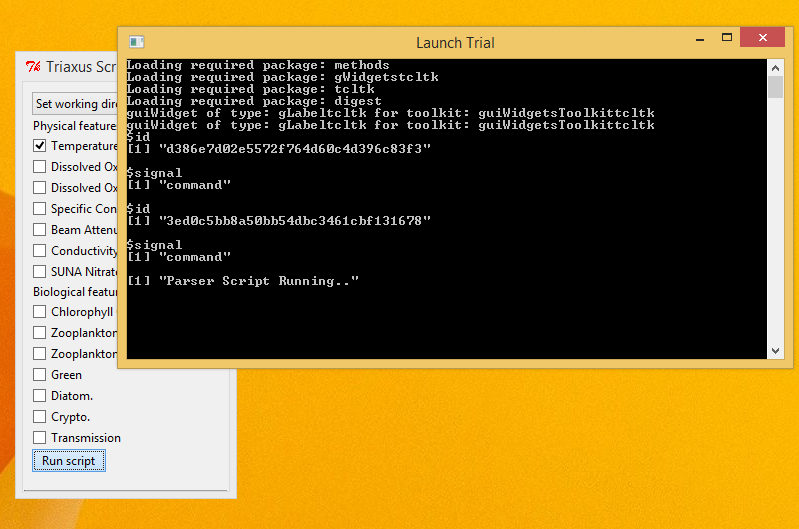
- Click the 'Run script' button to start the script execution.
- The Console window would give real time status updates on the script's execution.
- Once the script finishes execution, the output files should have been generated inside the 'Output' folder in the Triaxus directory.

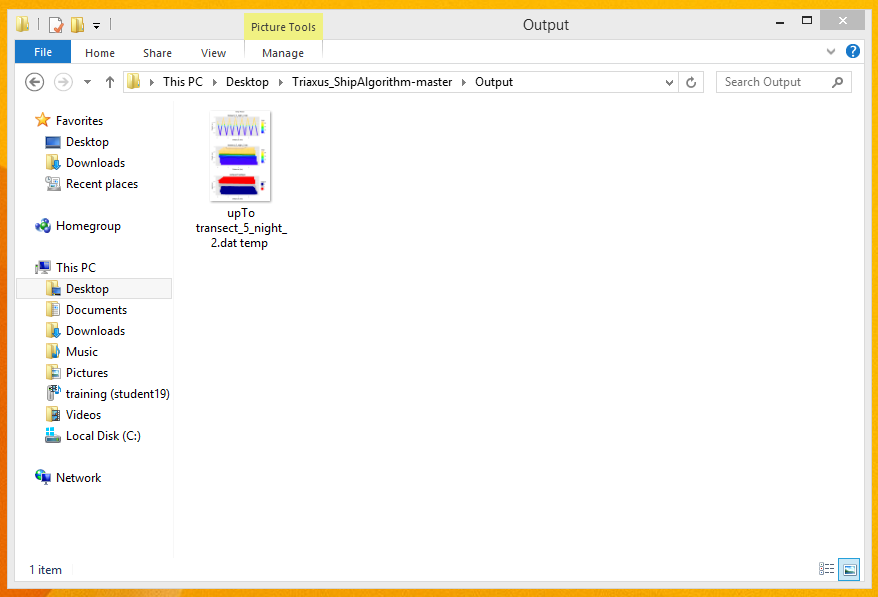
- Sample Outputs generated from the Triaxus Script for the Temperature and SUNA Nitrate features Triaxus Script Output : Feature = Temperature , Triaxus Script : Feature = SUNA Nitrate
Instructions for running the Seabird script on a windows machine
Steps
- Install Python version 2.7 from https://www.python.org/download/releases/2.7.7/
Install the scikit-learn machine learning library available as "scikit‑learn‑0.15.1.win32‑py2.7.exe" at
http://www.lfd.uci.edu/~gohlke/pythonlibs/#scikit-learnInstalling the Scipy stack for python 2.7 available as "Scipy-stack-14.5.30.win32-py2.7.exe" at
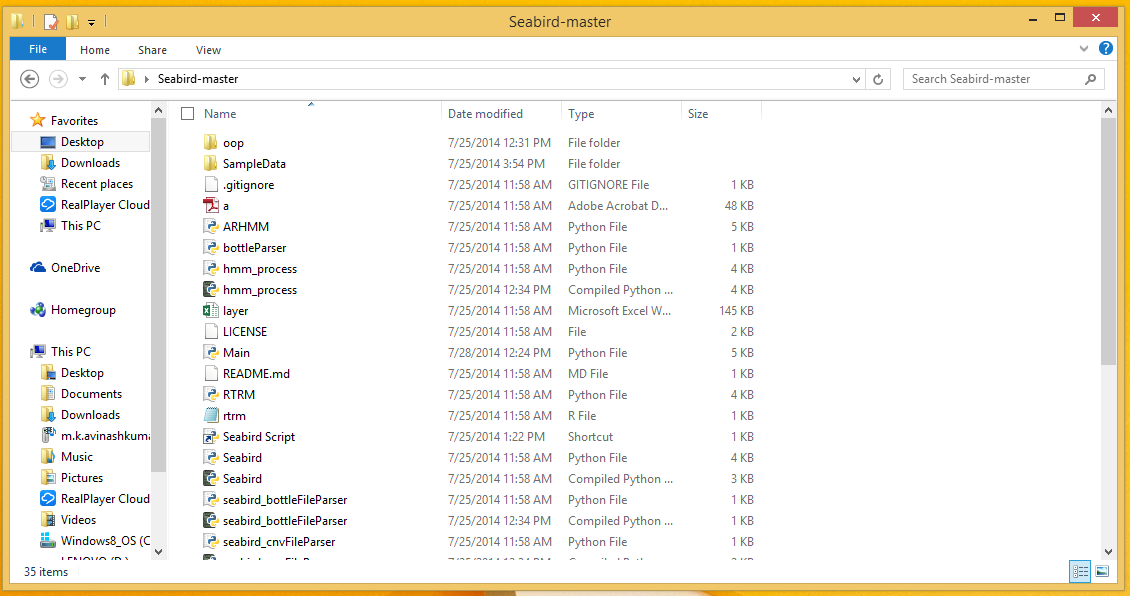
http://www.lfd.uci.edu/~gohlke/pythonlibs/#scipy-stack- Download the code from https://uofi.box.com/s/h6pvnackfmvq3kstzjznelmzg038rmyv16v8yht5 Extract the zipped folder and you should be able to see the contents as shown below.
- Execute the application by double clicking on the 'Seabird Script' shortcut.
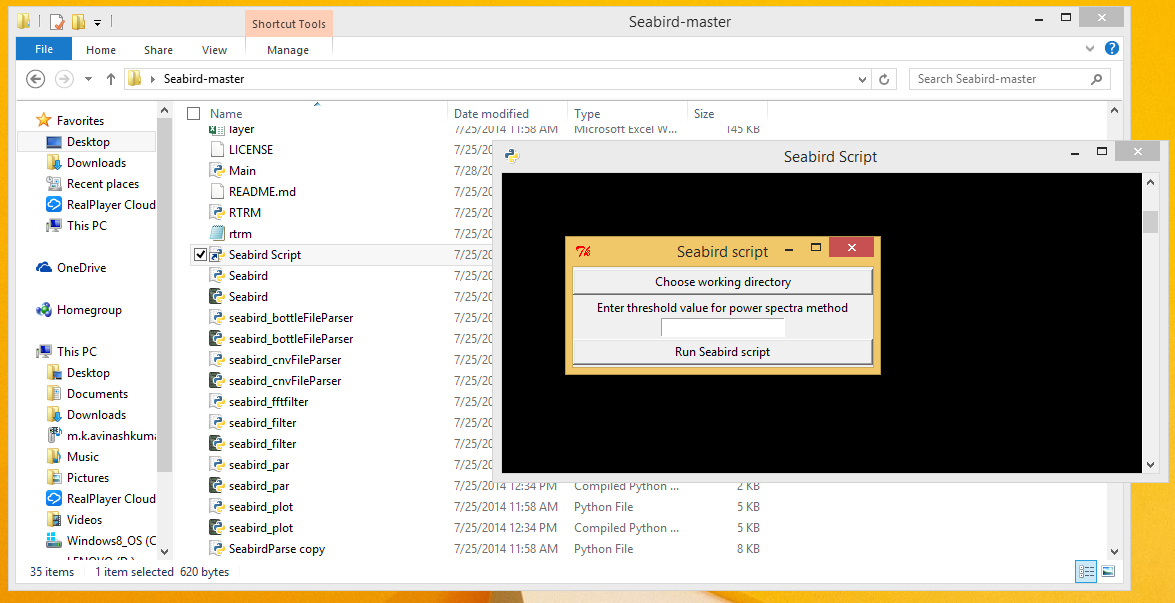
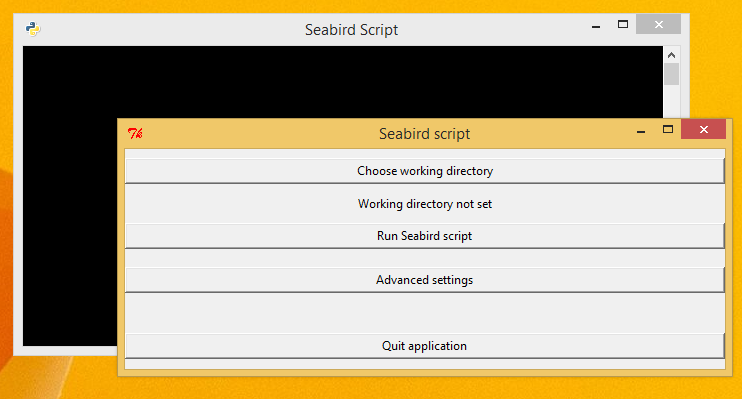
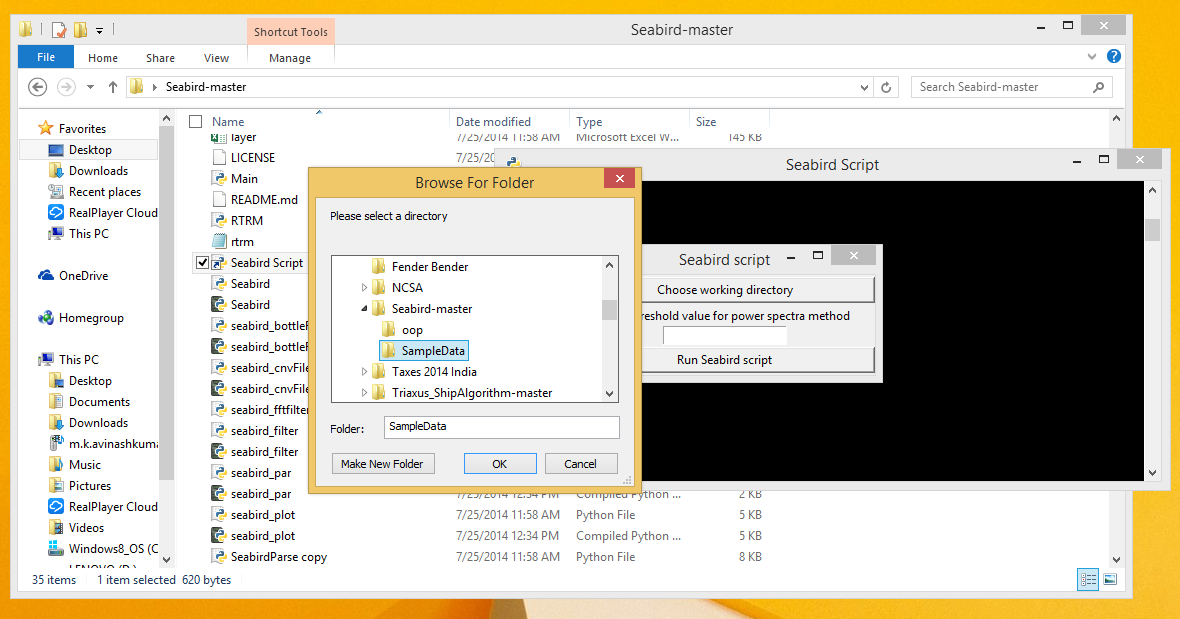
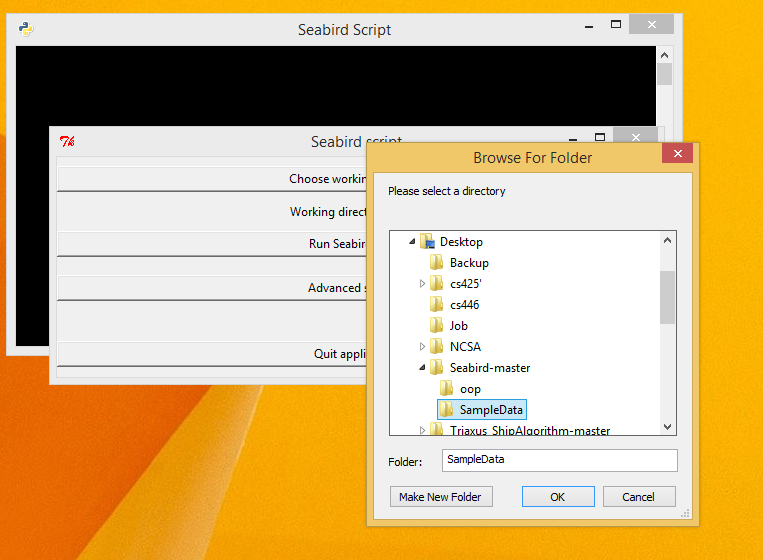
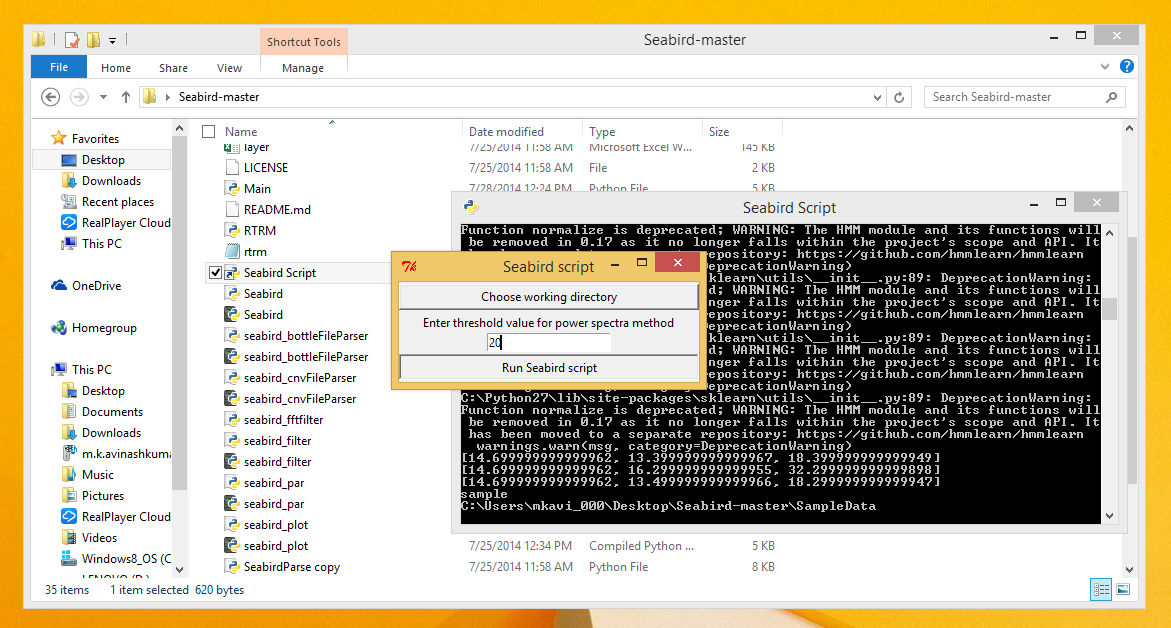
- Choose the directory where all the input data files as the working directory by clicking on the 'Choose working directory' button.
- If you wish to change some advanced settings for running the script, click on the 'Advanced Settings' button.

Click on the 'Save Settings' button to save the changes and get back to the main page. - Choose Enter a threshold value for the Power Spectra method if necessary and Click the 'Run Seabird scriptScript' button to execute the script with the settings previously chosen.
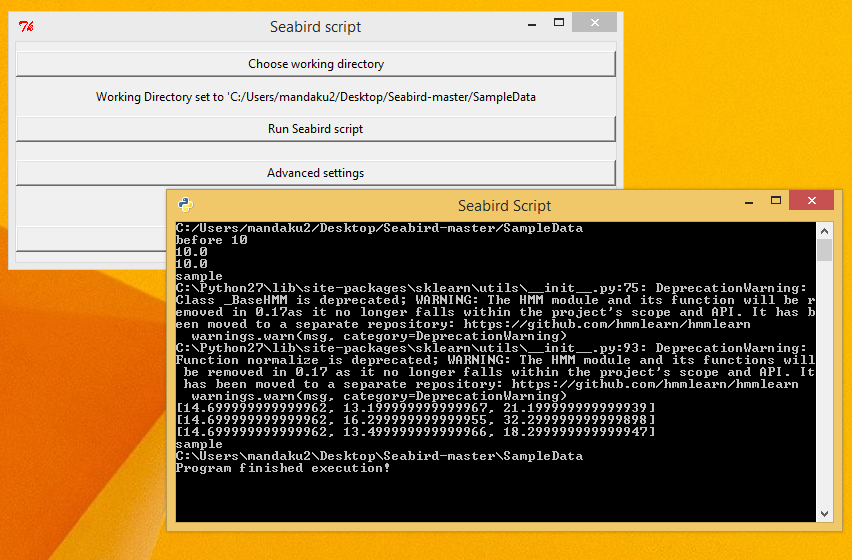
You should be able to see updates on the command line window as shown. - The output would Once the Script finishes execution, the output files should have been generated in the 'SampleData' folder designated as inside the working Seabird script directory.
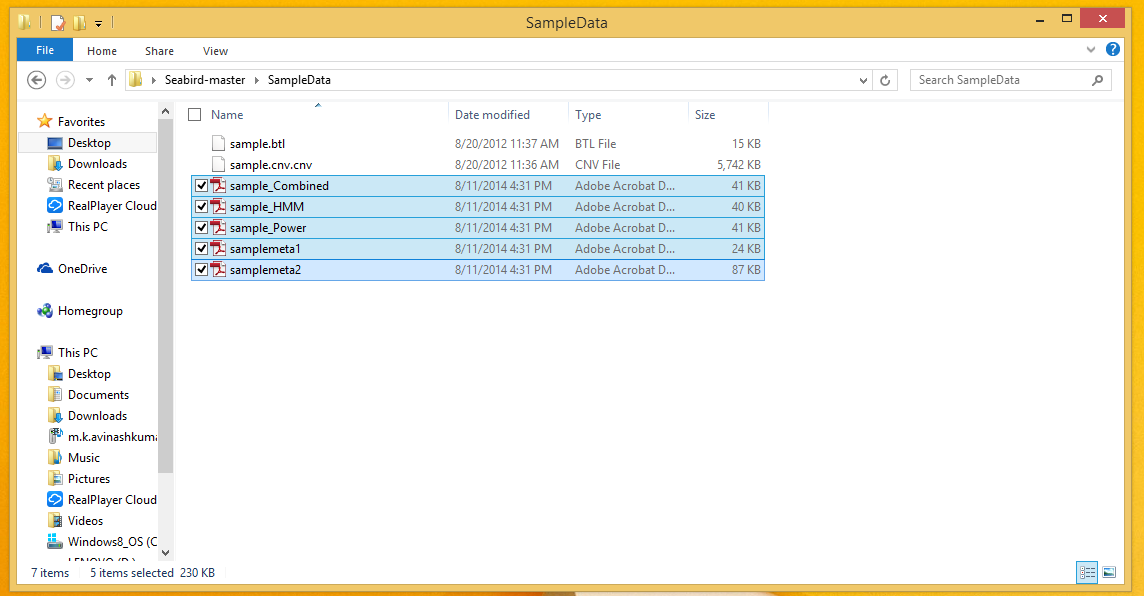
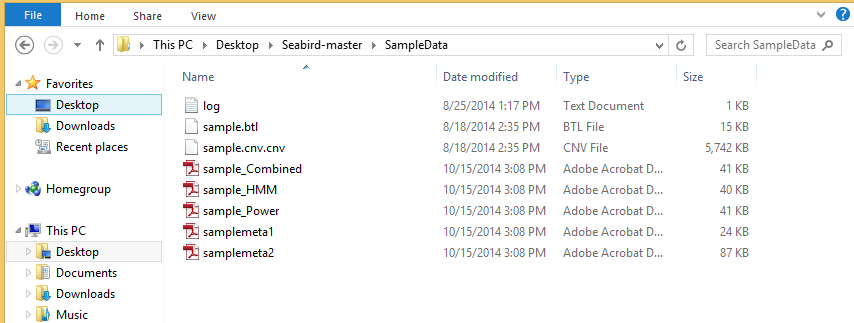
- Sample outputs generated from the Seabird Script HMM & Power Spectra Model Combined Output
Instructions for running the Triaxus R script on a linux machine
...
- Install R
- sudo apt-get install r-base
- sudo apt-get install libgeos++-dev
- Go to the R execution environment by entering sudo R
- Install various prerequisite packages through the following commands
install.packages("ggplot2")
install.packages("gstat")
install.packages("moments")
install.packages("fields")
install.packages("GA")
install.packages("spdep")
- Create a Folder called Result inside the applications directory and a sub folder called Variogram inside the newly created Result folder. These folders would be used by the script to store some meta data.
- Run the main entry R script for the application, by entering source("Main.R")
- The final output graph should be available as a pop up on the terminal.
Instructions for running the
...
Triaxus R script on a linux machine
Download the seabird code from https://github.com/stormxuwz/Seabird
...