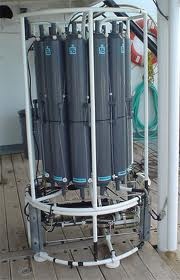
Note: Sample Seabird data from Lake Erie Summer 2011 is attached to this page, click on the paperclip in the left corner to access it.
Software used to get data form sensor: http://www.taltech.com/products/winwedge/
Software used for data processing: http://www.seabird.com/software/sbedataproc-seasaverev.htm
Raw data format from sensor should be HEX (confirm)
Sea Bird - Collected Data
Note: The data was classified into three sections based on late SU12 conversations with Paris: Interesting Seabird data parts
Other available seabird data types to being discussed in future
Seabird parameters that have been identified as messy & error prone
|
Derived Data Products
Thermocline Identification
- The zone at which warmer and cooler waters meet in the water column.
- Data Inputs:
- # name 0 = depFM: Depth [fresh water, m]
- # name 1 = t090C: Temperature [ITS-90, deg C]
- # name 0 = depFM: Depth [fresh water, m]
- Analytic(s):
- Result visualization: Line Graph representing the zone.
Deep Chlorophyll Layer and Maximum (DCM)
- A layer of elevated chlorophyll found below the epilimnion where evidence of phytoplanton accumulates mainly in the form of increased oxygen concentrations.
- Data Inputs:
- # name 11 = flSP: Fluorescence, Seapoint
- # name 11 = flSP: Fluorescence, Seapoint
- Analytic(s):
- Result visualization:
Photic Zone
- The depth of water that is exposed to sufficient sunlight to enable photosynthesis.
- Data Inputs (provisional)
- # name 4 = par: PAR/Irradiance, Biospherical/Licor
- # name 7 = bat: Beam Attenuation, Chelsea/Seatech/WET Labs CStar [1/m]
- # name 8 = xmiss: Beam Transmission, Chelsea/Seatech/WET Labs CStar [%]
- # name 13 = spar: SPAR/Surface Irradiance
- Analytic(s):
- Result visualization:
Hypoxia Layer
- # name 14 = upoly0: Upoly 0, DO, mg/L Optode 4330FA
